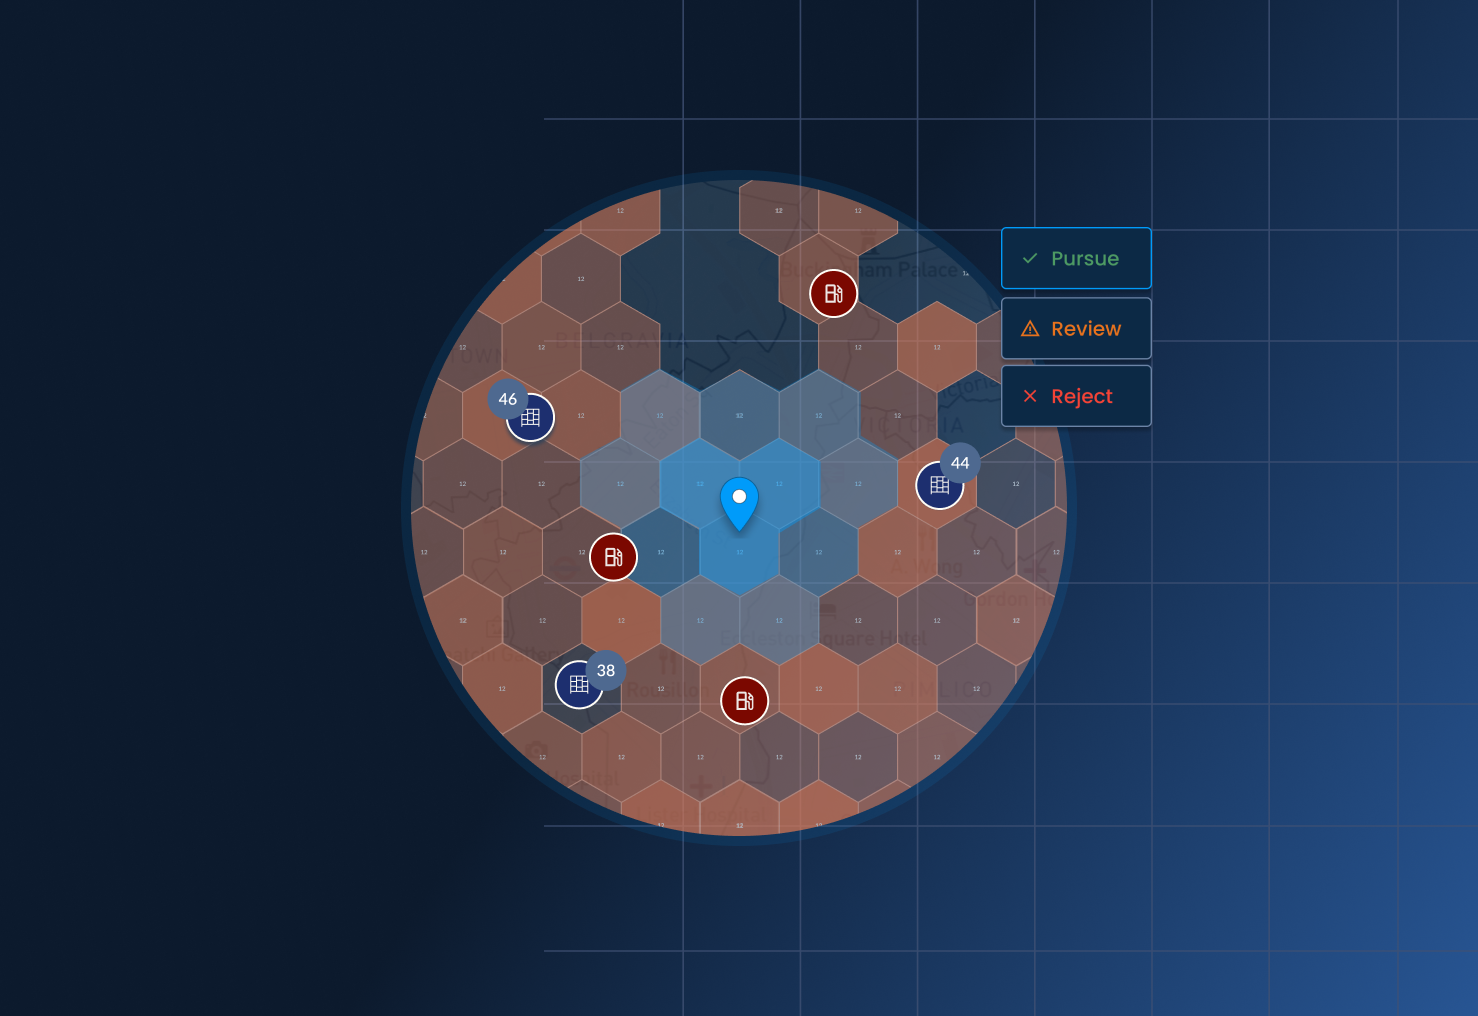
Country analysis: the macro view of your OOH network
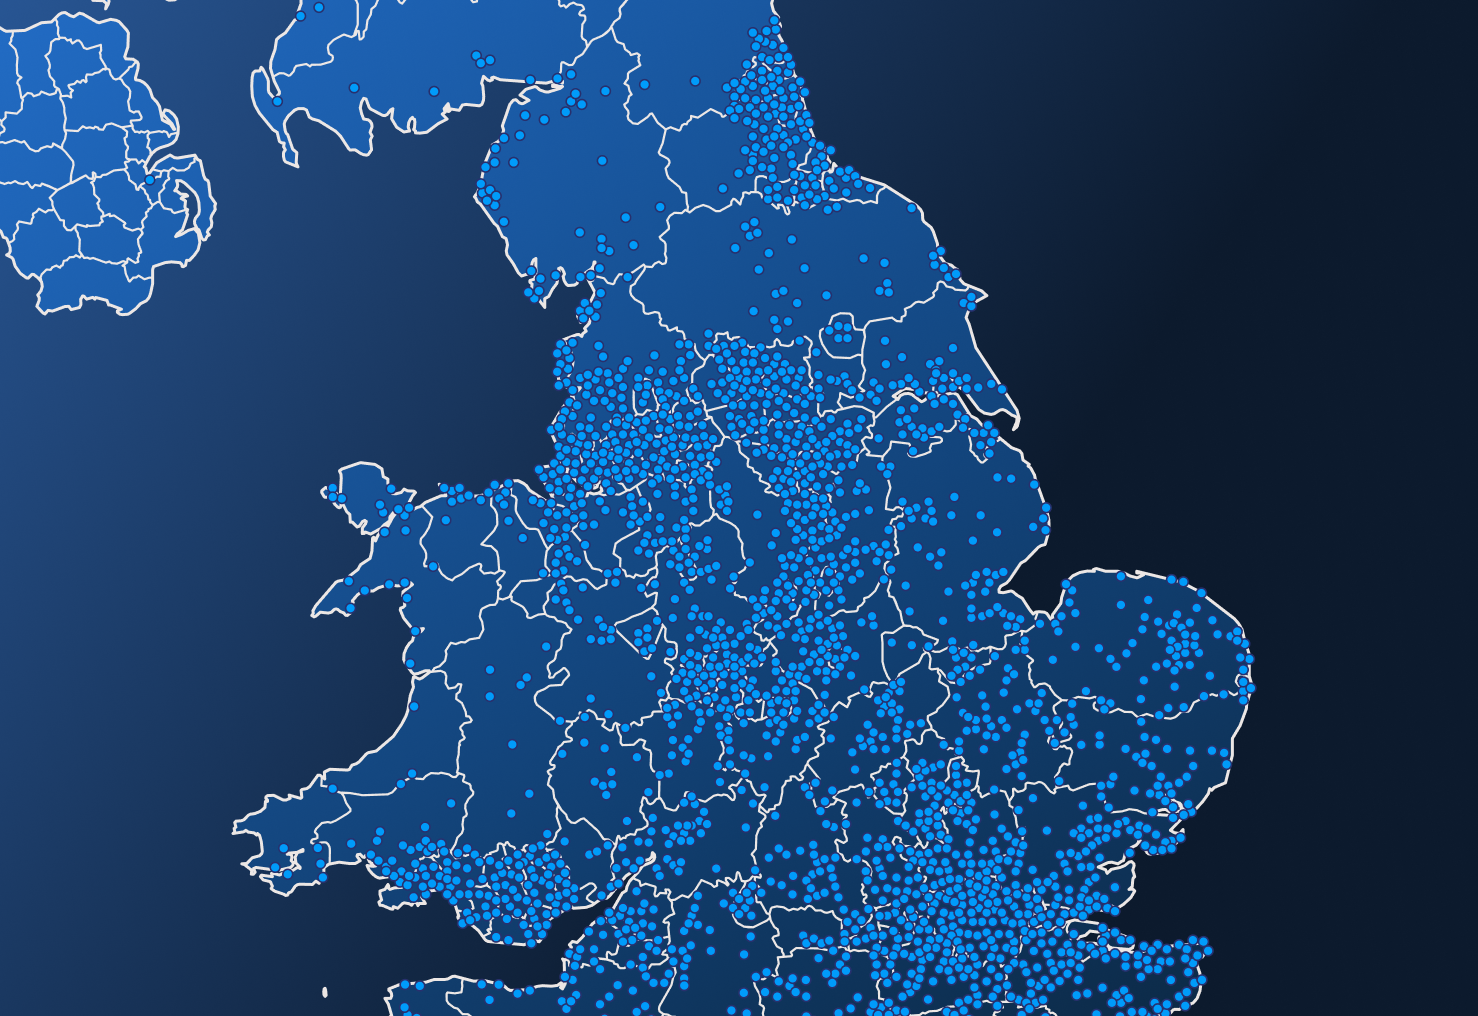
Where does coverage fall short across the market? Which regions are still below your location targets? Are you serving rural areas well enough?
Country analysis answers these questions. It's the macro view of your OOH network, showing how many people you reach, how coverage differs across regions and region types, and how your locations are distributed.
What you can learn from it
Each analysis reads your network through two lenses. One looks at each region on its own: its coverage, its lockers and shops, and its population. The other shows the bigger pattern: regions grouped by coverage level and type, with the strongest and weakest standing out. Together, they answer four questions every network team faces.
How evenly is your coverage spread?
A national average can hide very different realities. Urban, suburban, and rural regions can be viewed separately, and every metric recalculates for the group you focus on. You see how evenly your network serves different kinds of areas, and how much of your reach depends on the cities.

Where does your network fall behind?
Ranking regions by coverage and population shows where large numbers of people have the least access to your network. Grouping regions by coverage level surfaces clusters of weak coverage and unexpected outliers. These are the regions where new locations would make the biggest difference.
Where could your network be leaner?
Strong coverage has a cost. Regions with high coverage and the most lockers and shops show where your network may have more locations than it needs. These regions are worth a closer look when you want to cut network costs while keeping your footprint.
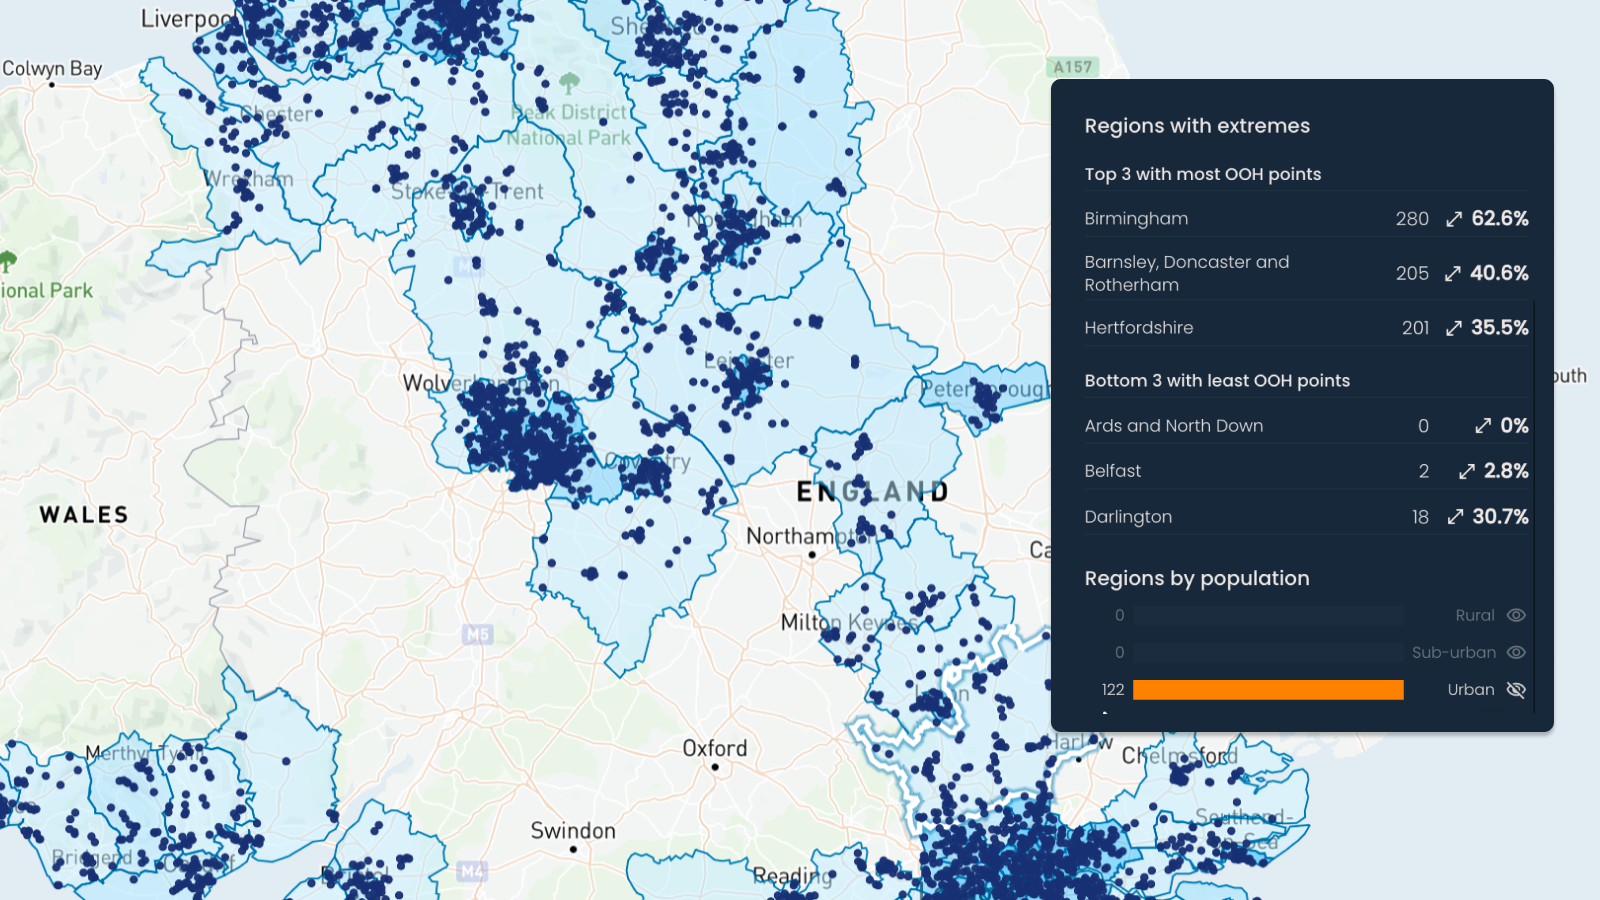
How do your markets compare?
Every country is measured the same way, with the same coverage method and the same EU regional standard. That makes it possible to compare markets side by side and see which ones need attention first. You can also leave out regions outside your scope, so each view reflects the part of the market your team is accountable for.
What you walk away with
The result is an evidence-based picture of your network's national footprint, ready to share with the whole team or with other stakeholders.
Most importantly, you know where to look next. The regions that stand out become the starting point for your planning and action. From there, you can model adding, removing, or relocating locations within a region before committing resources, with everyone working from the same numbers.
Which region will be your next network move? Find out with Country analysis.