

Capacity Planning in Strained Parcel Locker Networks
.png)
Real parcel-locker networks are rarely designed all at once with perfect foresight. They evolve under different pressures: one operator races to cover ground quickly, another spaces nodes uniformly over a certain area, a third grows the network gradually as demand data comes in. Some of them proactively readjust the network over time, while others stick to the initial configuration and setup without revisiting past decisions.
But demand changes over time, and a network built for past needs may not meet today's requirements. Staying competitive means capacity planning has to keep pace with that shift, not just observe it. And once strain becomes visible, the fix is rarely obvious.
Capacity Strain Index
In our previous blog, we introduced the Capacity Strain Index (CSI) as a single, comparable number per location, so you get a clear answer to the question, "Is this location under strain?" The CSI collapses catchment overlap, competing demand, physical capacity, and pickup speed into a single number that is enough to inform the decision.
The way we mathematically define CSI is as follows:
where Q is the potential shipments within the location's catchment area, t is the length of the observed time period, t average dwell is the average time an item spends sitting in a locker before pickup, and capacity is the location's physical capacity.
Aside from its diagnostic value, the CSI can be used as a guide for optimization. It narrows down the search space of certain heuristics by targeting only pivotal points that require change. Also, a cleverly designed derivative of global CSI can be used as an objective function in the optimization.
In this blog, we designed a CSI-based network health metric. It is based on the overall network deviation from the ideal CSI value of 1. For every active location, we compute how far its CSI sits from that ideal and weight the deviation. Since overcapacity and undercapacity aren't equally costly, we can treat them asymmetrically by introducing a weighting parameter.
For the whole network, the individual di are summarized, and the overall health metric is derived:
CSI Repair: A heuristic framework for capacity planning
The idea behind the framework is simple: rely on a handful of heuristics, each performing individual actions, all aimed at pulling the network's CSI values as close to 1 as possible. CSI Repair runs in 5 stages, one after another, starting with the simplest network modifications and working up to more rigorous ones. Here's what each stage does:
- Stage 1: Capacity adjustments. For every locker in the network, a heuristic searches for its best-fit capacity relative to its own CSI. It stays within whatever maximum size is allowed at a location.
- Stage 2: Capacity consolidation. A heuristic looks for overpopulated clusters of locations and trims their combined size by removing unnecessary capacity. We've explored this heuristic in more detail in our previous blog.
- Stage 3: Location removal. This heuristic identifies obsolete locations in the network and disables them.
- Stage 4: Location swap. Sometimes a location is better off closed and replaced with a nearby unopened candidate that fits the demand landscape better - that's what this stage looks for.
- Stage 5: Opening new locations. This heuristic opens new locations with the goal of relieving undercapacitated locations whose capacity can not be increased further.
Any network modification needs to be performed carefully by considering the impact on the neighborhood. The CSI Repair evaluates each step relative to the overall network performance. This ensures that local improvements do not lead to globally worse solutions.
Experimental setup
To test whether CSI Repair actually helps regardless of how a network was built, we constructed five distinct scenario groups. Each one simulates a different, genuinely plausible network construction habit.
Some scenarios build the network once, right at the start, and never revisit that decision - covering habits like greedy coverage-first growth, a demand-blind uniform grid, and a zonal approach that builds each map quadrant independently before merging with no reconciliation.
Others evolve the network incrementally over time, considering each period's real demand as they go, with some subvariants also proactively relieving already-strained locations along the way or only gradually discovering which candidate sites are even available to grow into.
Separately, a small set of merger scenarios simulates two independently built networks joining together in the final period, as if two smaller operators had merged.
Across all of these, subvariants are also defined by capacity sizing - from a fixed standard locker size, to placing the largest locker a site can physically fit, to more fine-tuned demand-aware approaches that size a location relative to its actual competition.
This results in 35 distinct scenarios of network development whose outputs will be used as a basis for CSI Repair.
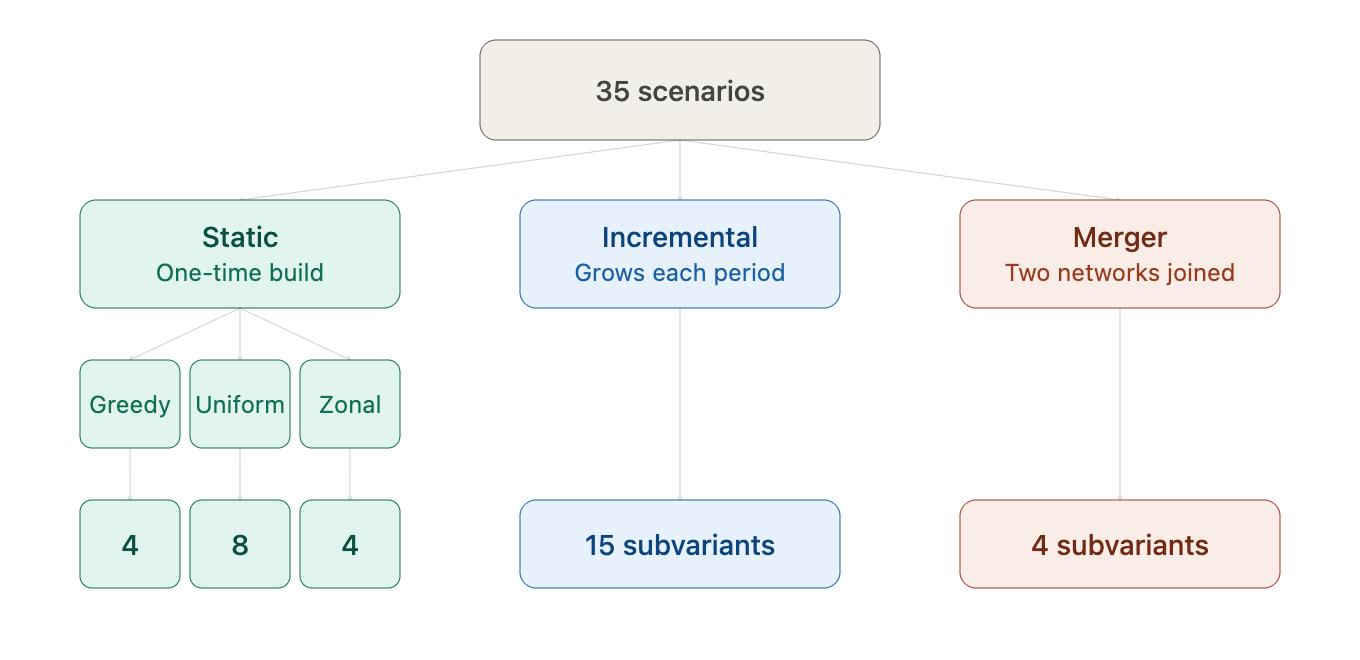
Every scenario is overlaid atop the same 12-period demand horizon. In each period, the demand landscape shifts a little - it gradually grows and slightly changes spatial patterns. Whatever network state and demand landscape exist at that final period is what gets handed to CSI Repair.
Putting it to the test
We applied CSI Repair to 20 European urban areas, with a population ranging from 50k to 1.5 million. Every urban area is simulated through each of the 35 scenarios. This gave us a rich set of 700 different networks built under different conditions and strategies, potent for testing the framework. Undercapacity has been penalized more than overcapacity by a factor of 1.33, and the average dwell time of locker items is set to 1.5 days. The optimization time horizon spans over 30 days.
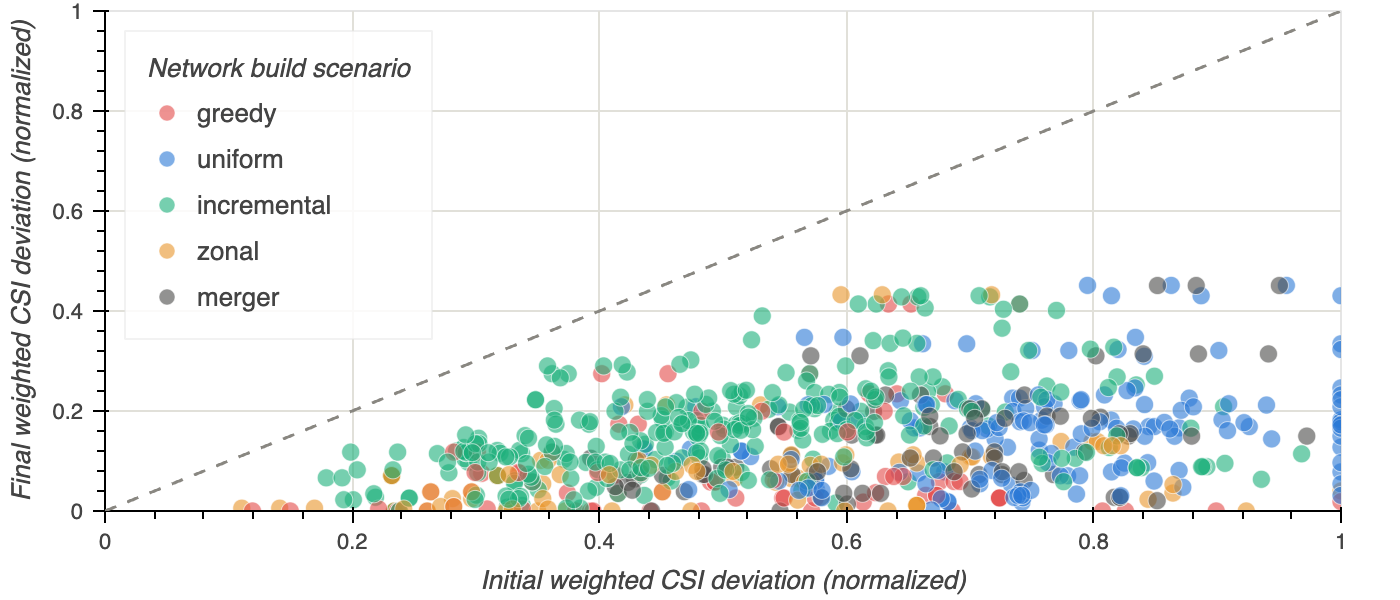
To visualize CSI Repair's impact on network health, we plotted the initial versus final health metric (weighted CSI deviation) for each area-scenario instance. Values are rescaled to a 0-1 range within each urban area's own results, so areas of different sizes can share one axis. A point below the diagonal line means that the network ended up healthier than it started. Across all 700 instances, every single one does. The improvements range from 8% to 85%, with an average of 43%. This is strong evidence that CSI Repair can root out network inefficiencies that accumulate over time from inadequate or untimely planning.
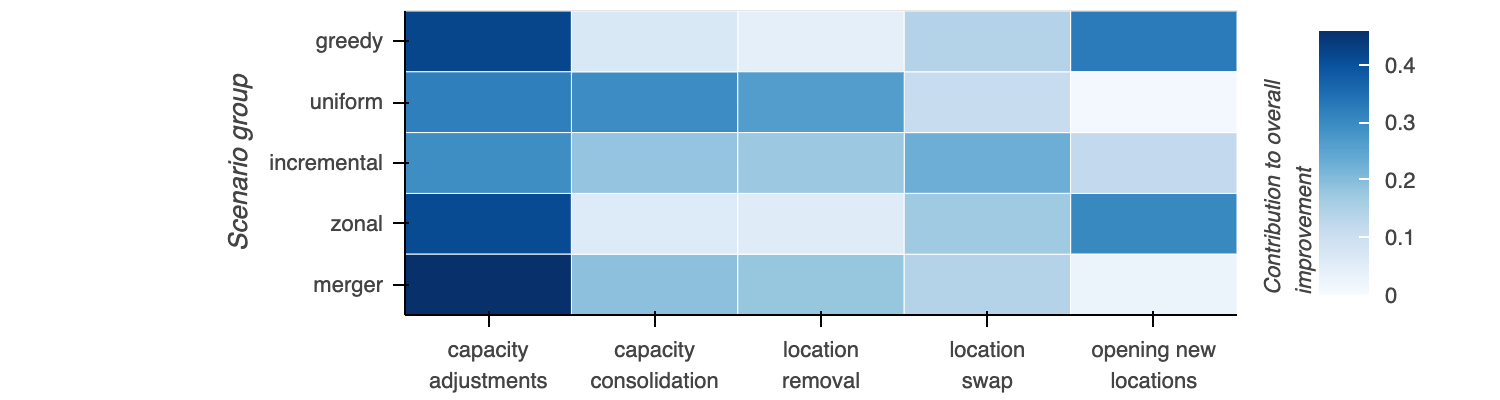
Capacity adjustment contributed to most of the improvements overall. However, depending on the chronic inefficiency, different stages pulled more load-bearing work.
For example, setting fixed standard locker sizes left capacity adjustment with the most room to improve the network, accounting for 50% of the improvement. Opening additional locations to relieve currently strained locations in the evolutive approach opened up space for capacity consolidation and location removal, each responsible for 22% of the gains.
Location removal proved most useful (responsible for 35% of overall improvement) when the candidate pool wasn't known upfront - when it grew gradually, discovered over time. Scenarios where two networks merged naturally left plenty of room for consolidation, removal, and location swap stages.
Location swap did its best work resolving local optima left behind by demand-aware, proactive construction approaches, making up 22% of the improvement there.
Opening new locations outperformed other stages in scenarios with fixed, non-evolutive network construction habits such as greedy and zonal (accounting for 33% and 30% of improvements, respectively), but always followed an above-average location swap activity. The heatmap below shows the relative amount of improvement achieved by each stage when aggregated on the five main scenario groups.
Aside from health improvement, tracking capacity changes and redistribution also helps paint the picture of stage involvement in reshaping a network.
We tracked how much total locker/shop capacity CSI Repair actually moved per stage, split by scenario group. A distinction is made between capacity changes due to opening and closing locations outright (darker portions in the figure below) and capacity gained or lost from resizing locations (lockers) that remained active (lighter portions). Bars above the line mean net capacity added at that stage, below the line means net capacity is removed.
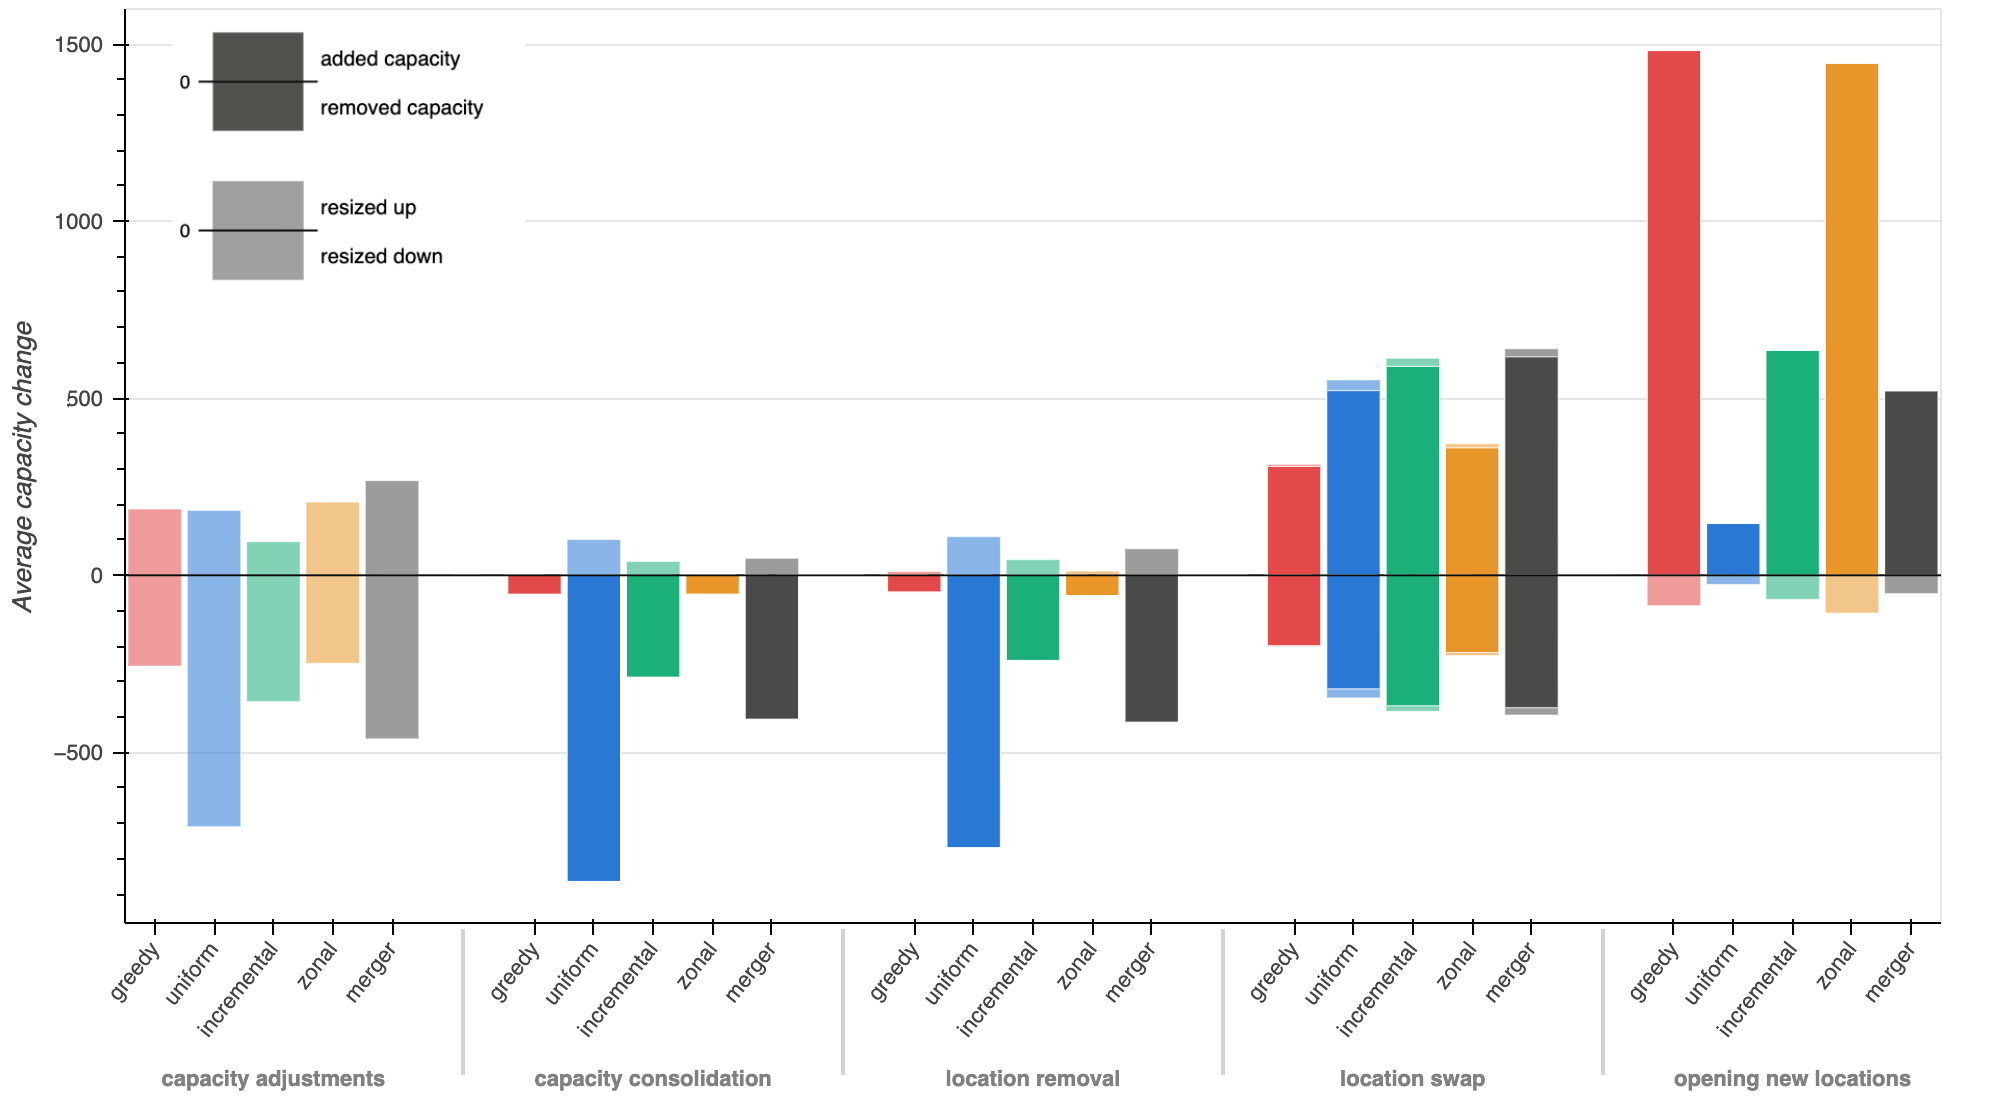
The capacity adjustment stage tended to size down excess capacity 2.7 times more than adding new capacity on average. The activity of the capacity consolidation and location removal stages did not exclusively result in removing capacity, either. Thanks to our neighborhood-aware logic, their activity comprised 11% and 14% of capacity increase as well. The swap stage's added-versus-removed capacity ratio averaged 1.6. Lastly, 8% of the opening new locations stage's capacity activity came from reducing neighboring locations' capacity.
Although the capacity adjustment stage handles the bulk of capacity right-sizing on its own, that isn't where fine-tuning ends. Every later stage that changes network configuration also carries a real, secondary resizing effect, even though adding or removing locations is its primary job.
Consolidating or removing a location shifts demand onto its neighbors, and opening a new one pulls demand away from nearby locations, so each of these stages quietly re-adjusts some existing capacity as a side effect of the membership change it was actually making. Even though these changes do not contribute much to the overall capacity change, they were required to fine-tune the modification to actually match the demand landscape.
The takeaway
This experiment demonstrates something simple but easy to underestimate: with the right indicator, and heuristics genuinely guided by it, a locker network can be improved regardless of how bad its starting state is. Overall CSI improvement translates to fewer overflow situations, less unnecessary capex on new lockers, a more rational spatial distribution of capacity, and ultimately a better experience for the end consumer.
None of that works without knowing where to look first. The CSI identifies the network's critical points, which is what lets each heuristic act with precision instead of guessing. It is important to note that no network change is free of side effects. Every modification ripples into its local neighborhood, and ignoring that ripple is how a fix in one place creates a problem somewhere else. Every stage in CSI Repair accounts for that by design - which is exactly why the improvements hold up rather than just moving the strain around.
This is part of ongoing research at Mily Tech into network optimization. If you're interested in solving similar problems, reach out at research@milytech.com. We'd love to collaborate.


.png)
