Capacity Planning in Peak Periods
Demand for out-of-home (OOH) delivery isn’t flat. Black Friday, Cyber Monday, and the holiday season reliably drive shipment volumes far above the norm. Logistics networks designed for typical conditions often can’t absorb the spike. Parcel lockers are no exception. Lockers and shops that comfortably handle everyday volumes can suddenly receive far more parcels than they have room for.
Network operators know this is coming and plan ahead, usually by adding capacity. But knowing you need more capacity is the easy part. The harder question is “Where?” Which locations are actually going to be strained, and which new candidates will do the most to fix it?
Identifying overflow
A natural first instinct when demand surges is to scale capacity uniformly. Unfortunately, this does not hold up because demand pressure isn’t distributed evenly. A location’s exposure to a surge depends on its catchment, the capacity it already has, and how much of the surge lands on its neighbors. A uniform capacity bump overcorrects in some places and leaves others just as exposed as before.
As established in our previous blog, the Capacity Strain Index (CSI) already accounts for this interplay. Recomputing CSI under a peak-period demand projection tells us which lockers and shops are headed toward strain once the surge hits.
Based on the CSI value, we can determine the excess demand for any given locker. This excess translates directly into a concrete amount of shipments the location can’t absorb in the given period: the overflow.
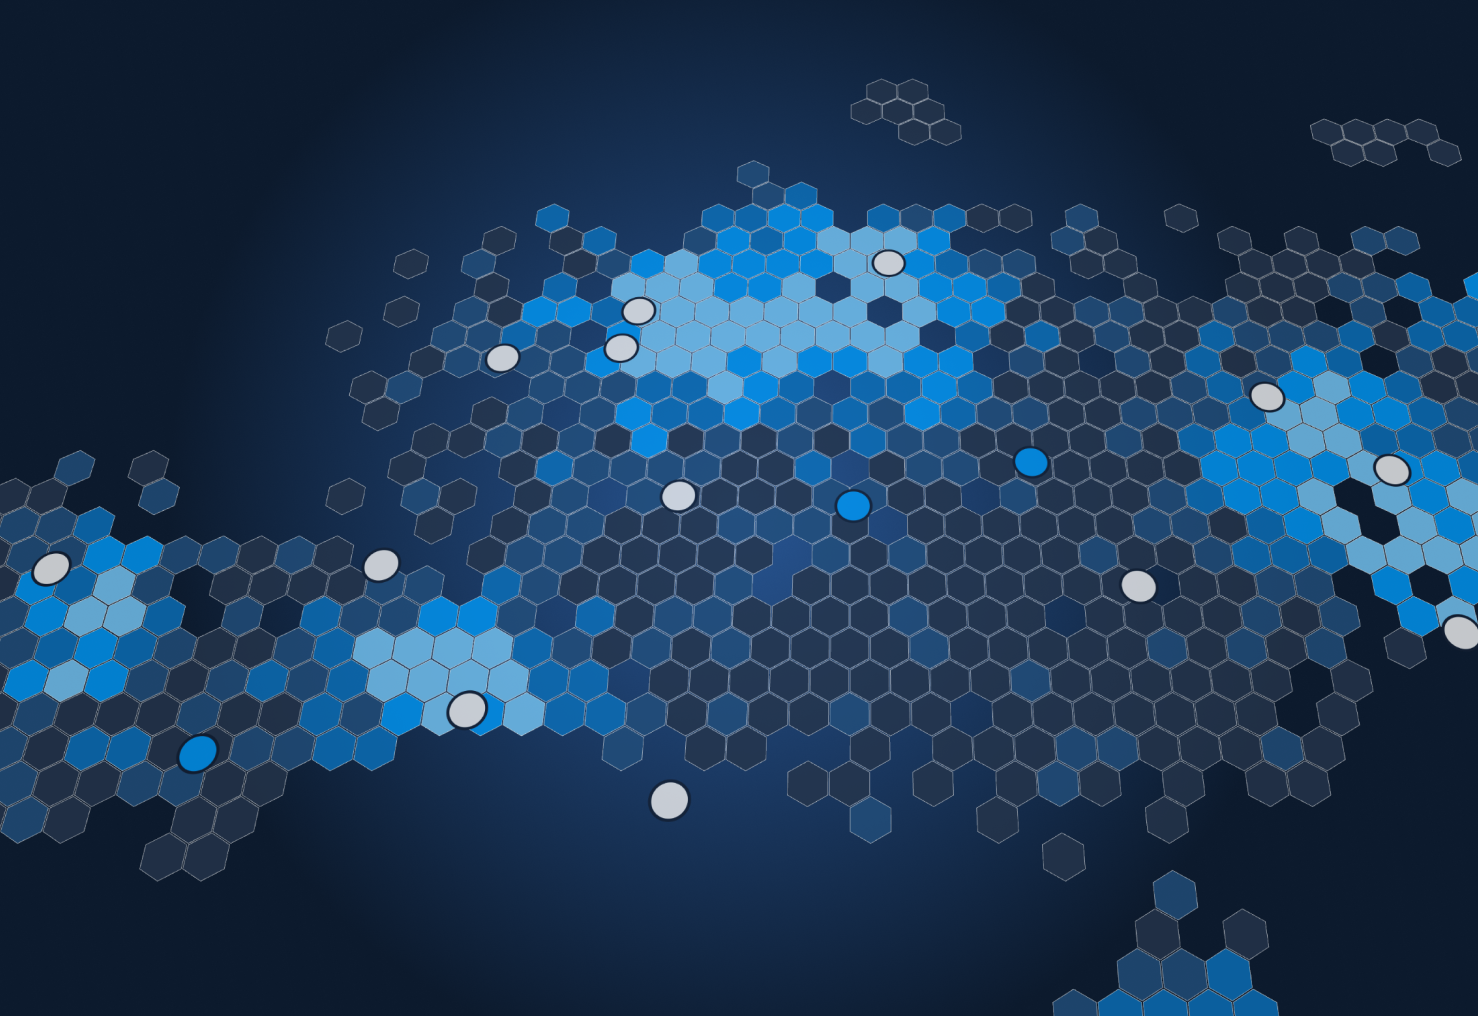
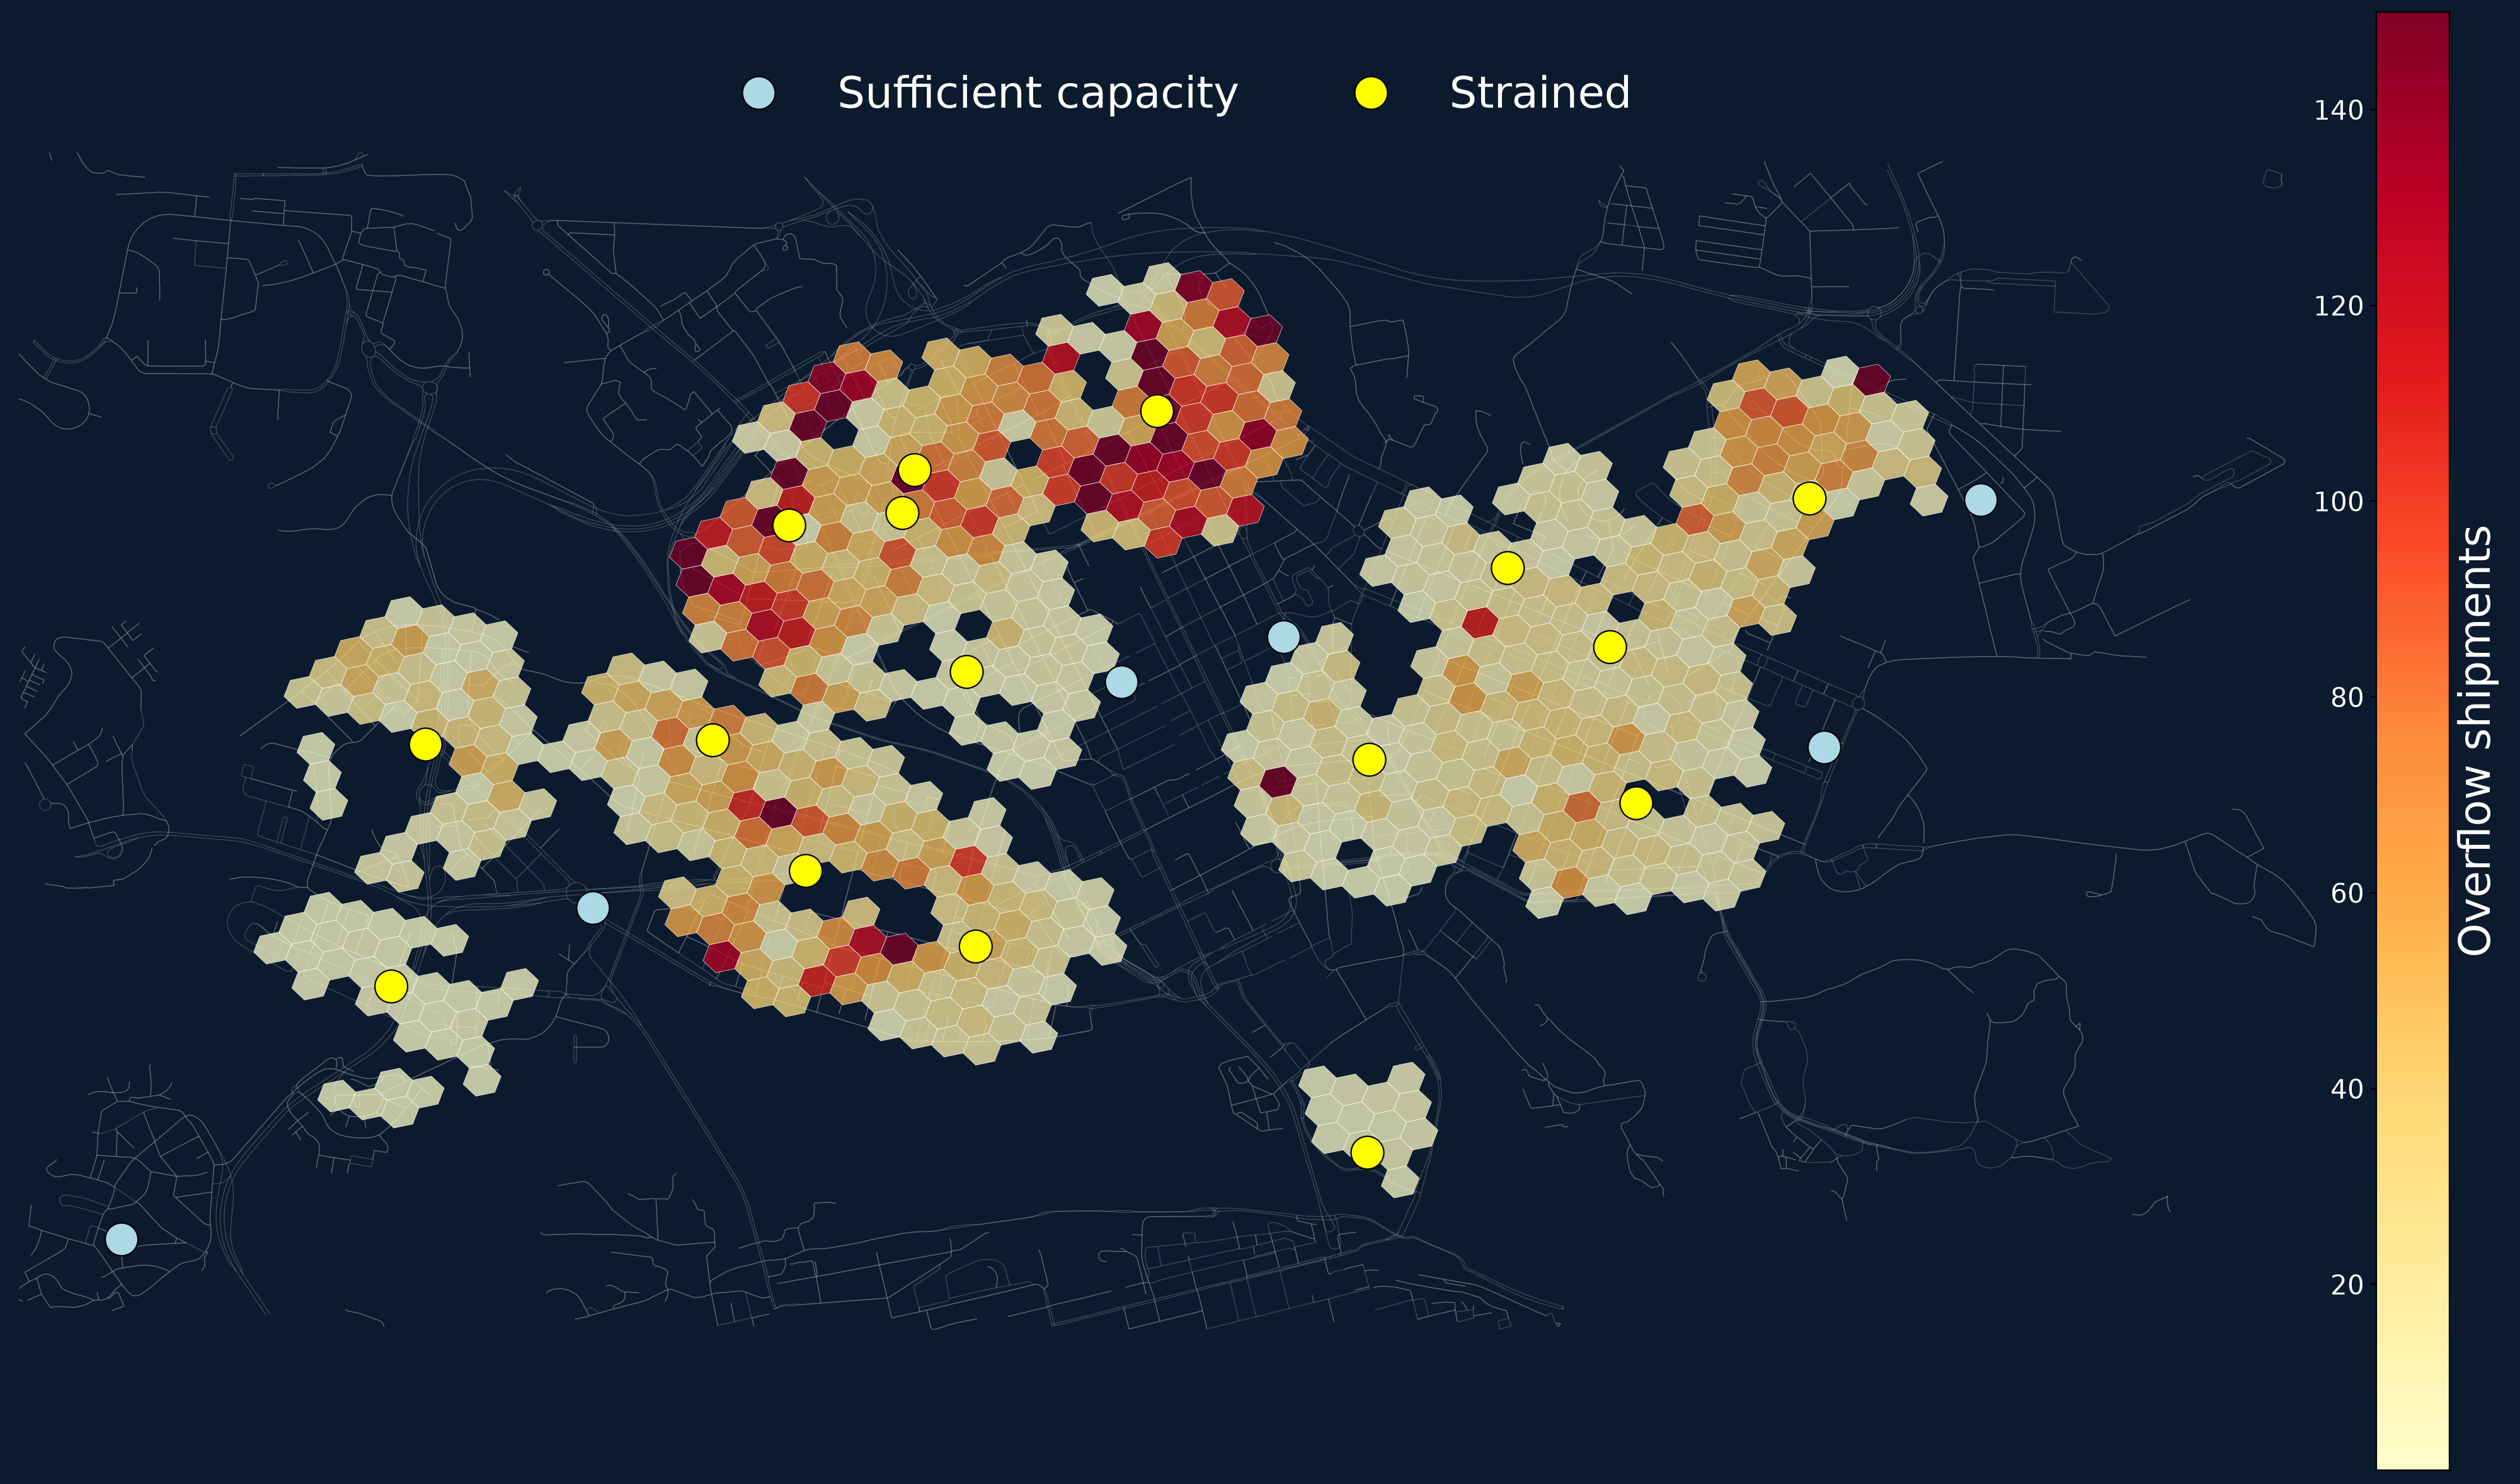
The two views below make this distinction visible. The first shows the network through the lens of CSI - which locations are under strain, and by how much, relative to their own capacity.
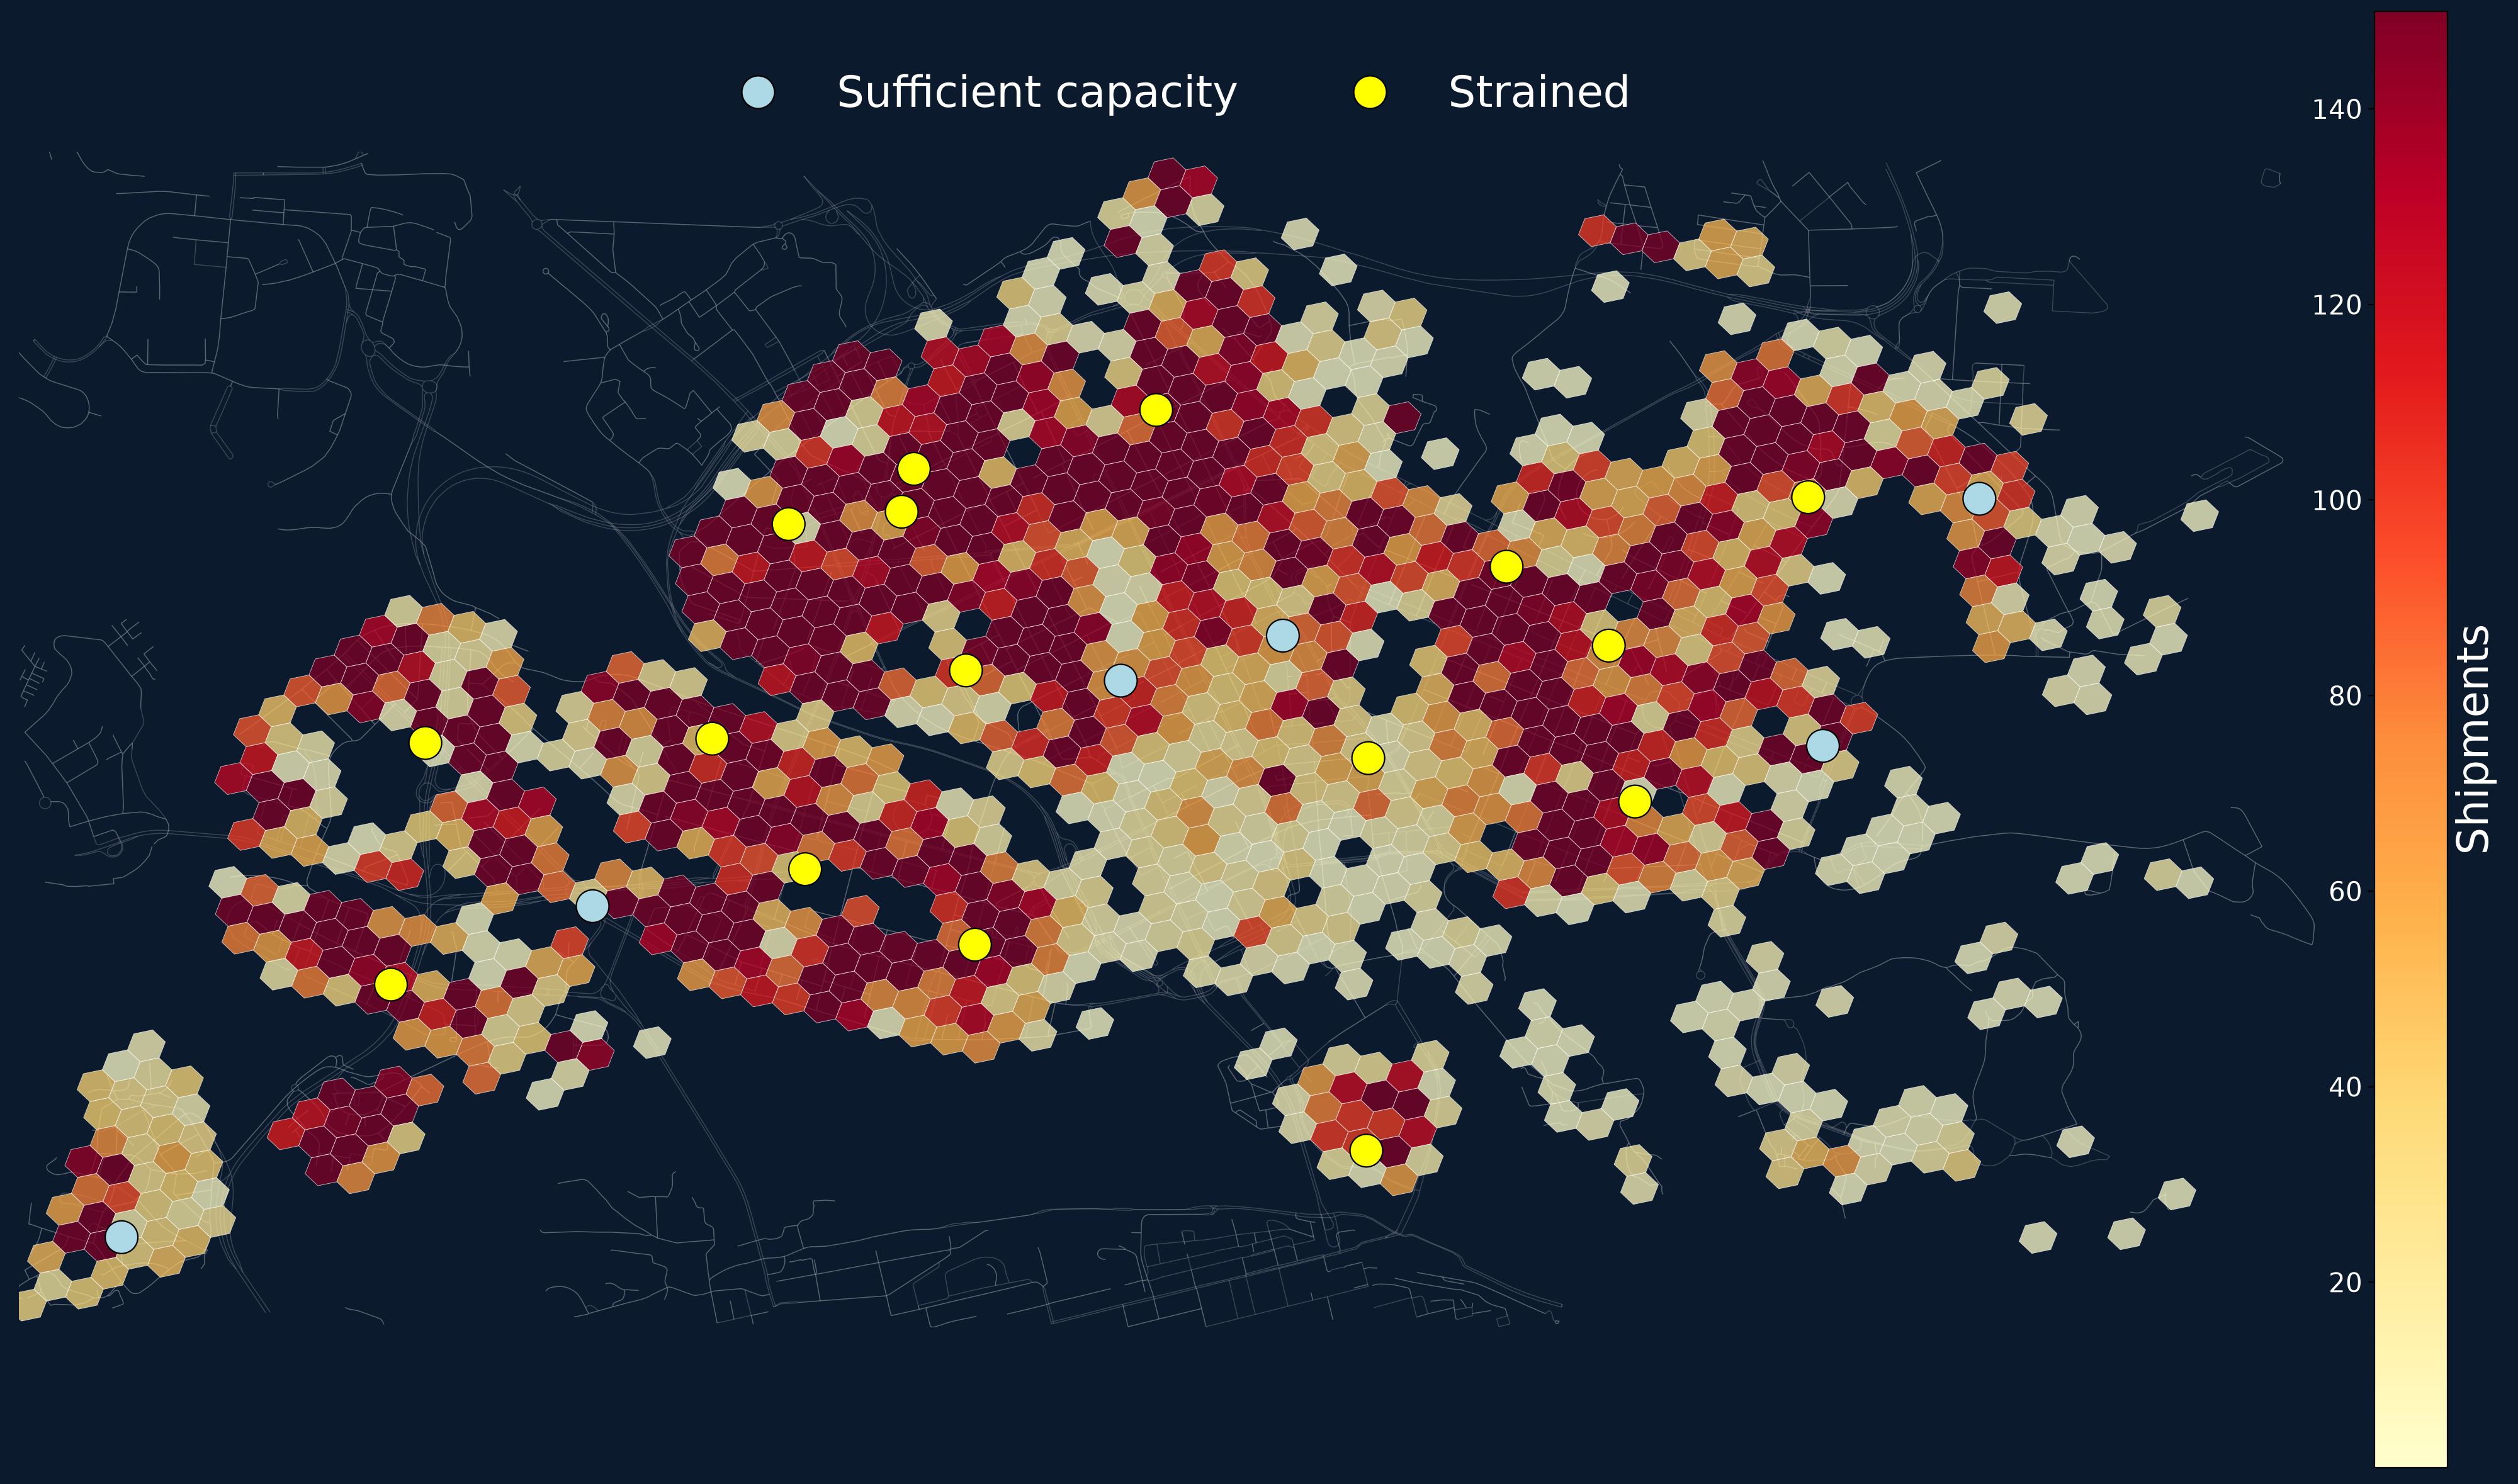
The second shows the same network and the same peak-period projection, but through the overflow layer. It shows the actual shipment volume stranded at each location.
With the critical areas of the network identified, the question becomes unavoidable: what do you actually do to make the network absorb this rising demand?
Relief strategies
Deciding where to open new locations is a more delicate problem than it seems. Whichever strategy one might choose comes with a tradeoff or a blind spot. We tested six distinct approaches, moving from map-driven instinct an operator might have, to increasingly deliberate, strain-aware logic.
The instinctive approaches:
- Approach 1 - Classic set covering. Open as few new locations as possible, chosen to cover as much of the overflow area as possible with their catchments. The thinking: the more of the overflow layer you cover, the more thorough the relief.
- Approach 2 - Closest candidate per strained location. For every strained location, independently open its single nearest unopened candidate. The thinking: stop treating this as an area problem and treat it as a per-location problem.
- Approach 3 - Cluster then relieve at the centroid. Group strained locations that sit near each other, then open one new candidate near each cluster’s center. The thinking: one well-placed location can relieve several strained neighbors at once.
The more deliberate approaches:
- Approach 4 - Resolve one target at a time. Start from the single most strained location. Keep opening the candidate that helps it most until it’s no longer strained, then move on to the next-worst location. Repeat until nothing strained remains. The thinking: give each problem spot undivided attention until it’s actually solved.
- Approach 5 - Re-rank after every addition. Start from the most strained location and open whatever single candidate brings it the most relief. After the addition, re-rank every location by strain and repeat, rather than committing to the same target. The thinking: don’t assume the worst location stays the worst one. Relieving one spot can change who needs attention next.
- Approach 6 - Strain-oriented set covering. At every step, look across the entire candidate pool and open whichever contributes the most strain relief anywhere. The thinking: stop reasoning location-by-location altogether, and treat relief as a single, network-wide optimization against the overflow demand landscape as a whole.
Experimental setup
To put these six approaches to the test, we used a network covering a central urban area of a city of roughly 2 million residents. Peak-period strain was then layered on top, defined by three parameters:
- Severity - the overall multiplier applied to ordinary demand volumes;
- The number of epicenters - locations in the network chosen as hotspot anchors around which demand disproportionately piles up;
- Concentration - how much of the added demand gathers around those epicenters rather than spreading out evenly across the network.
We swept these three parameters - 10 severity levels, 3 epicenter counts, and 3 concentration levels, and for each combination ran 3 independent simulations under different random seeds. Altogether, this produced 270 distinct scenarios, each run against all six relief approaches from the previous section. A global maximum capacity ceiling has been set (150 slots) so that the newly opened locations can not be infinitely large.
Testing the relief
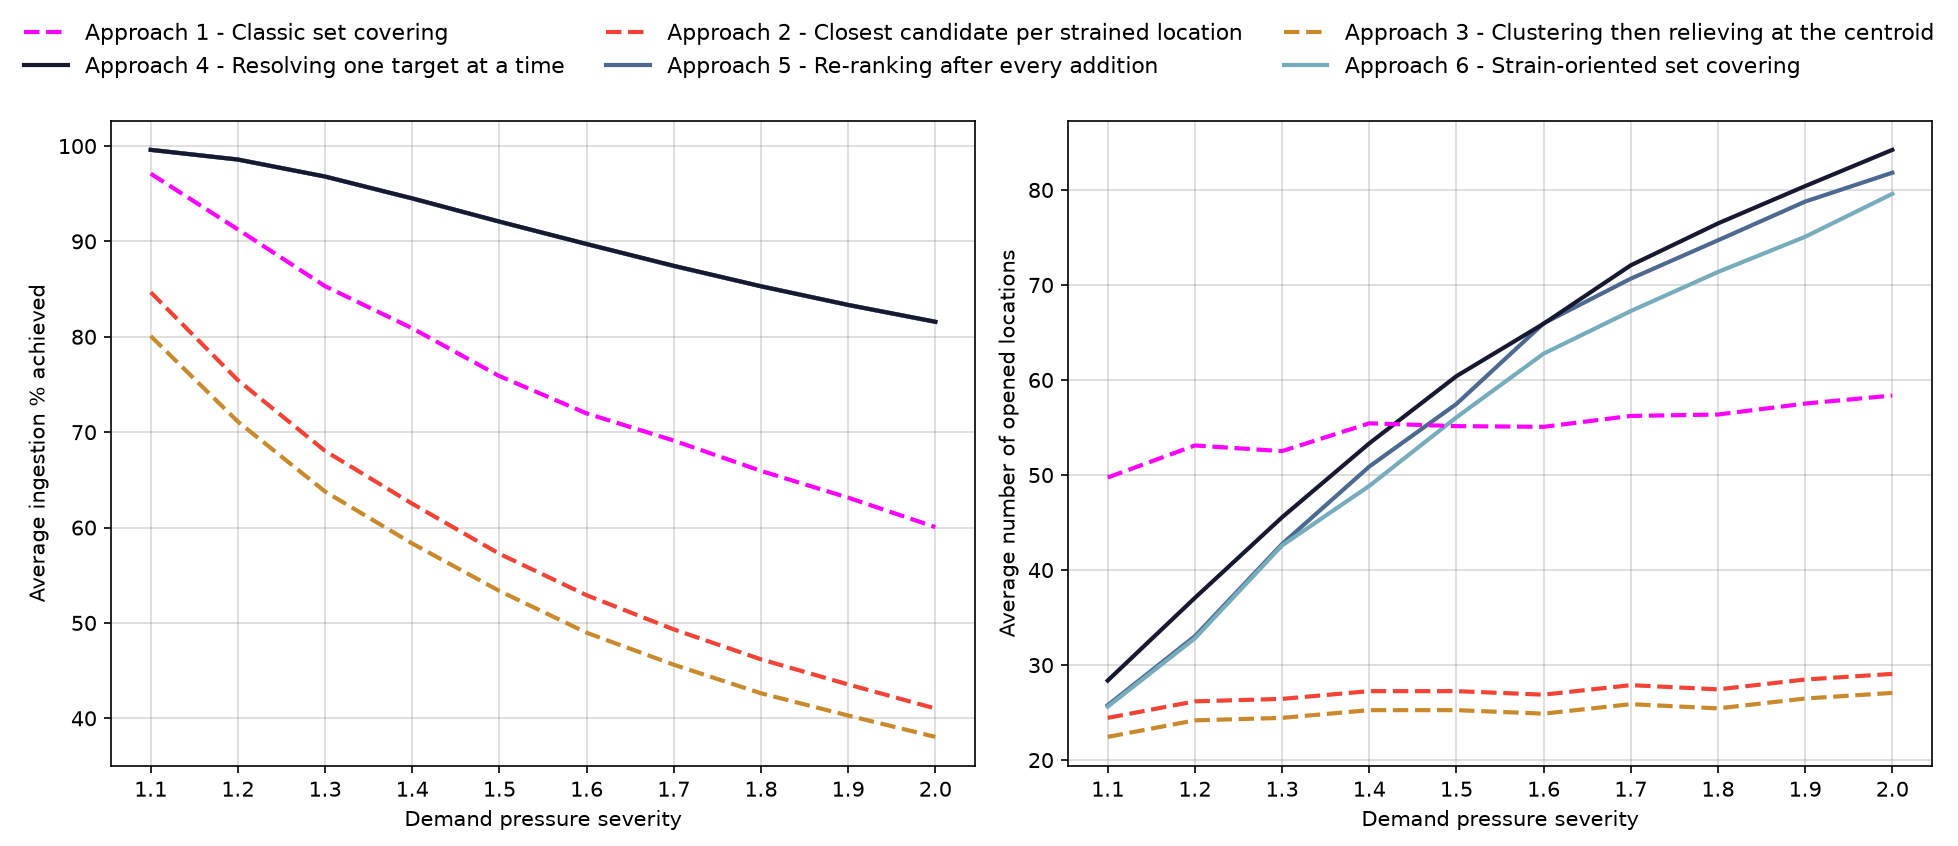
Across all 270 scenarios, the three more deliberate approaches (4–6) consistently recover more of the overflow than the three instinctive approaches (1–3). Interestingly, among the three deliberate approaches, there’s essentially no difference in the average share of overflow they manage to recover. They converge on roughly the same outcome, even though they arrive at it through very different logic.
The instinctive approaches fall short largely because none account for where excess demand concentrates relative to where capacity actually exists. They act on geometry or raw counts, not on the real shape of the strain.
The flip side of this is cost. The instinctive approaches open meaningfully fewer new locations to reach their result, and that number stays fairly flat regardless of how severe the peak gets. The deliberate approaches open progressively more locations as severity rises. This is a direct consequence of opening locations for as long as doing so helps, rather than stopping at a fixed, pre-decided threshold.
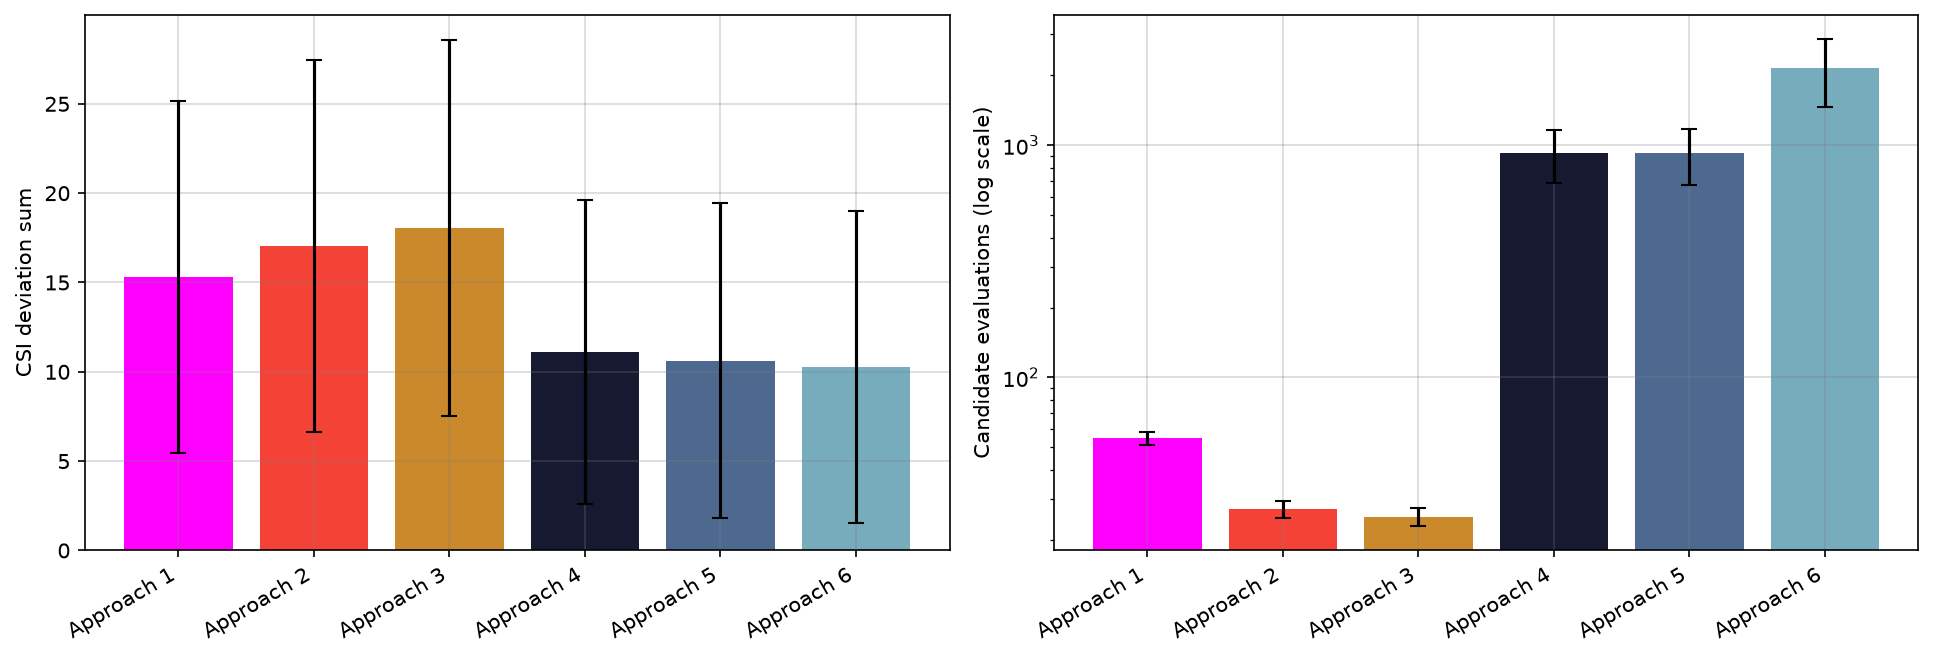
Beyond recovering overflow and location count, we also tracked CSI deviation sum and computational effort. As in our previous blog, we use CSI as a network-wide health metric that captures how far each location’s capacity is from its ideal fit. The computational effort is measured through the number of iterations. The instinctive approaches underperformed relative to CSI - 57% worse overall CSI deviation sum than the more deliberate approaches achieved. On the other hand, they required far less computational effort - 38 times fewer candidate location evaluations (3 times faster in terms of raw computational time).
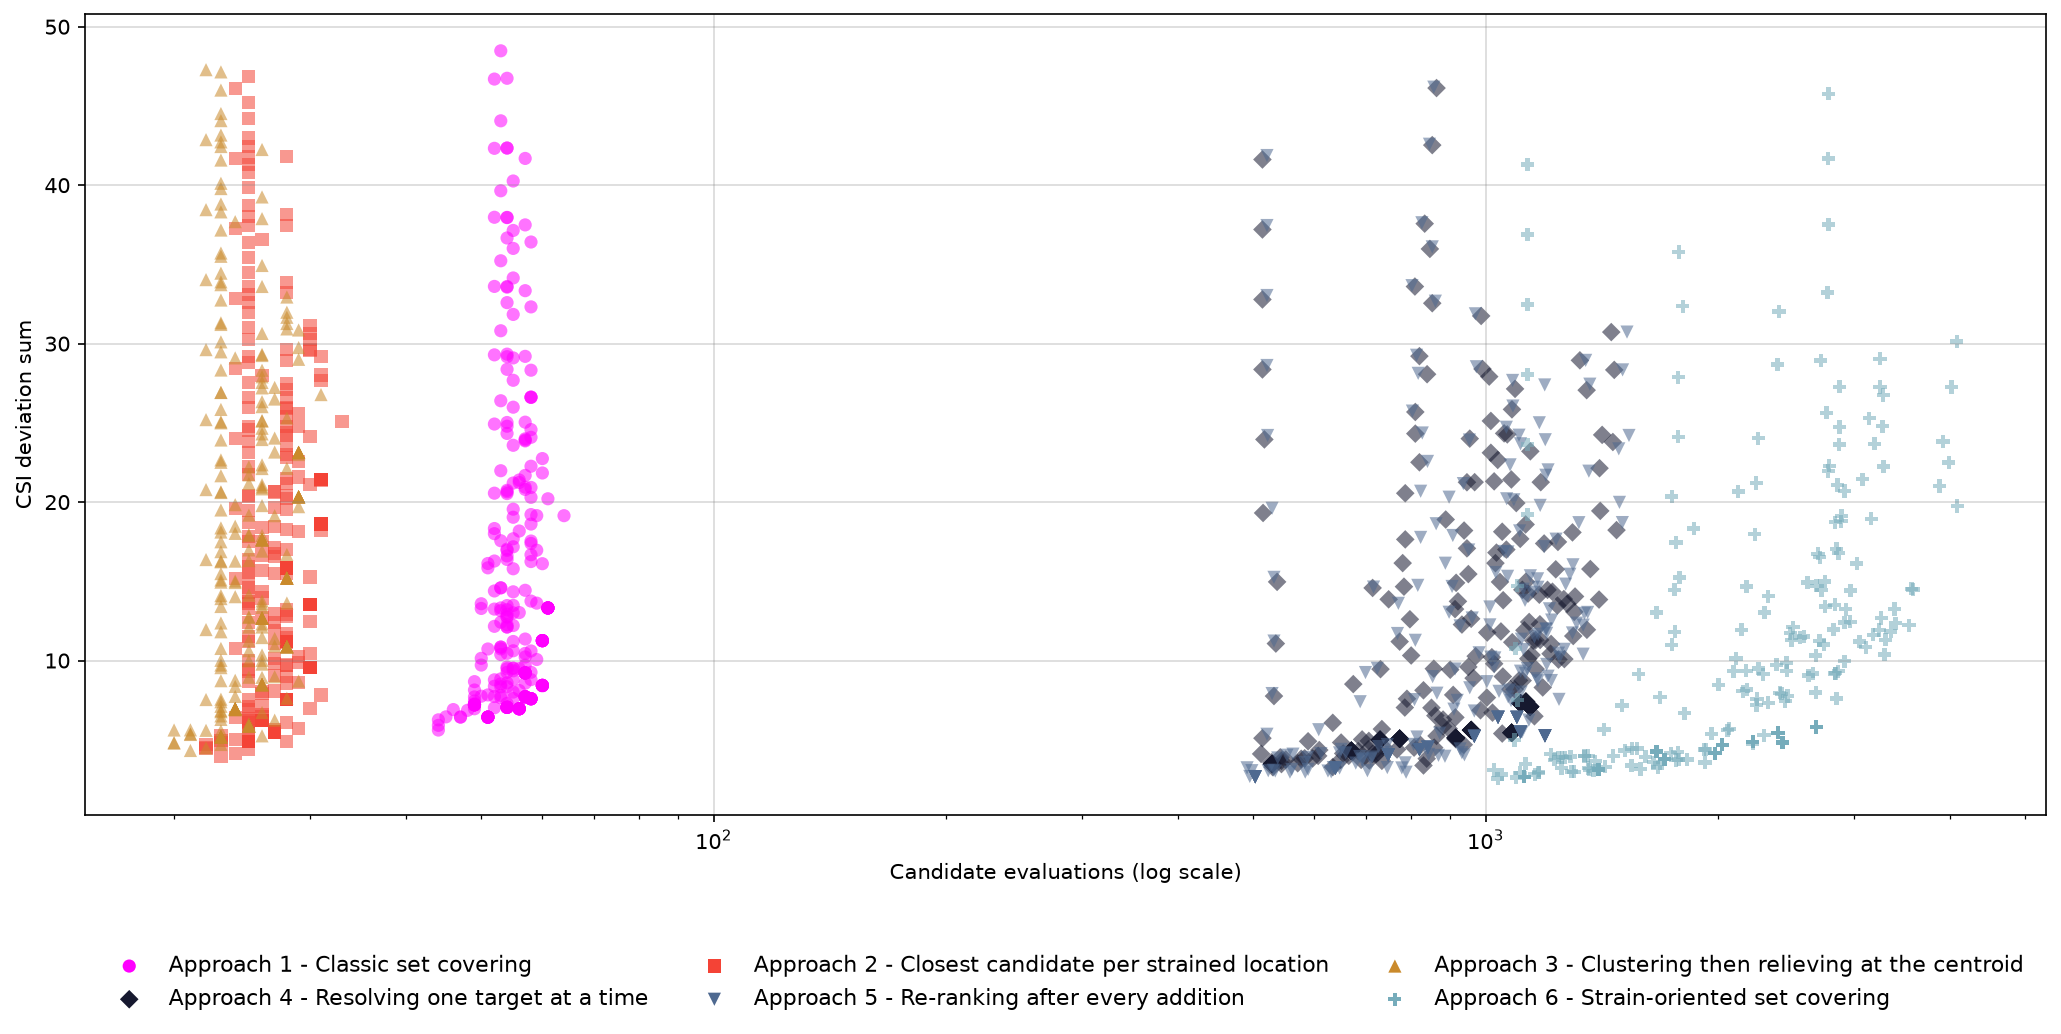
Approaches 2 and 3 were computationally the fastest, outrunning the other 4 approaches each time. Approach 1 was completely isolated from the rest relative to the CSI deviation as well as computational effort. Approaches 4 and 5 had significant overlap, while approach 6 outpaced them by a narrow margin in terms of network health, but was heavier in computational effort.
The takeaway
Intuition alone rarely relieves a network during peak periods. Yet, even simple algorithms perform noticeably better when they account for strain. Throughout, the CSI did the heavy lifting: it identified strained locations, defined the overflow layer of shipments, and tracked overall network health.
The most effective approaches act on the CSI at the network level, ensuring strain is resolved rather than pushed onto neighboring locations. The trade-off is computational cost.
This is part of ongoing research at Mily Tech into network optimization. If you're interested in solving similar problems, reach out at research@milytech.com. We'd love to collaborate.