Choosing parcel locker locations - Why it matters and how to get it right
.png)
Just as online shopping offers convenience and time-saving, e-shoppers crave the same when it comes to delivery methods, timing, and location.
While home delivery remains the top choice in most markets, out-of-home delivery is growing steadily. Parcel lockers are an example of this shift, as 27% of regular European online shoppers choose locker delivery, compared to the 23% the previous year.
Parcel lockers serve a dual purpose in the e-commerce journey. Apart from delivery, they’ve become a strong option for returns, with 26% of e-shoppers using lockers to send items back to retailers.
For parcel and postal operators, it means parcel lockers have become essential infrastructure. And whether for delivery or returns, convenience drives locker adoption.
This makes location the determining factor in whether a locker network succeeds. But how do you know if a location is good or not?
In this article, you’ll find:
- Why location matters for parcel lockers
- How consumer behavior and preferences influence site selection
- How to choose the best locations for parcel lockers
- Example: Scouting locations in London
Why location matters for parcel lockers
Location determines whether a parcel locker network succeeds or fails. If they aren’t convenient and along daily travel routes, people won’t use them, turning what should have been cost-saving infrastructure into money down the drain.
→ Calculate how much underused parcel lockers can cost you
But poor location doesn’t just waste capital investment. It also undermines the core benefit of parcel lockers: last-mile delivery efficiency.
Single-item e-commerce deliveries are costly. Parcel lockers address this by enabling couriers to complete multiple deliveries at one location, significantly reducing last-mile costs. However, this efficiency only materializes when lockers are strategically placed. Well-located lockers create better delivery routes, resulting in fewer vehicle movements and higher courier productivity. They also solve parking, one of the biggest operational challenges. Lockers in accessible locations with good parking infrastructure make drop-offs faster and more reliable.
Clearly, site selection involves balancing numerous factors, with consumer preferences sitting at the top of the list.
How consumer behavior and preferences influence site selection
Distance – Both studies and hands-on experience from postal and parcel operators consistently show that travel distance is a critical success factor. Online shoppers readily use parcel lockers if they are within 500 m of their home or work, or up to 1km. (It is helpful to note that these distances are most often quoted for urban areas.)
→ For operators: Prioritize locations that minimize customer travel time.
24/7 accessibility – The majority of online shoppers in Europe would choose parcel locker deliveries over home delivery if they could pick up their package 24/7, not just during business hours.
→ For operators: Prioritize installing lockers outdoors rather than inside buildings or retail spaces with restricted access hours.
Transportation modes – How consumers travel to pick up their parcels varies by location. In car-dependent cities, they often drive to lockers. In walkable cities, and when it comes to environmentally conscious groups, people use public transit, walk, or cycle.
→ For operators: In suburban or car-dependent areas, prioritize locations with well-developed parking infrastructure, such as shopping centers, gas stations, or large retail lots. In areas where driving is not the default mode of transportation, place lockers near transit hubs, pedestrian zones, and bike-friendly routes.
Digital literacy – Younger, tech-savvy consumers adopt parcel lockers more readily than older generations, who may be less comfortable with smart-locker technology.
→ For operators: Prioritize areas with a younger demographic, especially if you’re looking to place one of the first lockers of your network. However, this does not mean you should completely write off older consumers. Consumer characteristics influence both location and the service provided. For example, Latvia Post has integrated mailboxes into parcel lockers, making the technology more approachable and enabling multiple services at one location.
Online shopping frequency – Higher-income consumers, who shop online twice or more per week, show a strong preference for out-of-home delivery, with 46% opting for parcel lockers.
→ For operators: Look for affluent areas with high e-commerce purchasing frequency, as those locations can lead to higher utilization and faster ROI.
How to choose the best locations for parcel lockers
Each location has different potential, meaning they can reach a certain number of people and have different characteristics. The only way to assess location potential and make sure you choose the right ones is through spatial analytics.
With the right spatial analytics tool, you’ll be able to scout locations, simulate different network scenarios, and estimate outcomes before making commitments.
However, as helpful and powerful as tools can be, they’re just means. What’s just as important is your input – the data, thought process, and strategy to get to the list of high-potential locations.
Essential factors (and data) for parcel locker site selection
Demand – As established, consumer demand and preferences shape location strategy. Estimating demand tells you which locations will see frequent usage and what capacity each site needs.
→ Data:
- Population density reveals where people are located and can be layered with additional demographic data, such as age and income, to segment your target audience.
- Shipment distribution is a good estimate of demand and can also tell you which areas are overloaded.
- Movement data shows the travel patterns throughout a specific time period.
Competition – Knowing where your competitors operate helps you avoid oversaturated markets and identify market gaps – areas with unmet demand.
→ Data: Points of interest showing competitor parcel locker locations and other out-of-home delivery options like post offices and service points that may compete with your offering.
Partners – Using existing infrastructure is one of the fastest ways to expand your network. By forming partnerships, you can gain access to widespread locations with built-in foot traffic.
→ Data: Locations of potential partners, such as retailers, gas stations, and transit hubs, are also points of interest. Open network locations are also quite useful, especially if you’re thinking of expanding to rural and low-density areas where parcel volumes don't justify installing your own lockers.
Existing network – If you already operate lockers, knowing where they’re placed and understanding which locations perform well and why prevents repeating mistakes and helps replicate success.
→ Data: Parcel locker location data can also be combined with shipment volumes and utilization rates to reveal which sites need capacity expansion, how to prevent cannibalization between nearby locations, and whether underperforming sites should be relocated.
Example: Scouting locations in London
Let's say we're a parcel operator preparing to launch our first parcel locker network in London. We’re thinking about growing through partnerships with local shops and want to understand where to place our initial lockers for maximum impact.
For this first phase, we're looking at the City of London district and targeting 5-10 locations, which is a manageable number for our field team to visit and validate.
Setting the scope
Data we need:
- Population density: Shows where people are concentrated.
- Shipment volume: The volume and distribution of our deliveries.
- Points of interest data: Competitor locations and locations of local shops
How we'll measure coverage:
Since the City of London is a dense urban area, we'll calculate coverage based on a 500-meter radius around each location.
Tool:
We'll be using Mily Tech's OOH delivery analytics to evaluate location potential and plan the network.
Understanding the competitive landscape
Let’s start by mapping out the competitor’s network. Our competitor has 18 locations, with a coverage of 52% based on population data. This means that 52% of the population in the area is within 500 meters of competitor locations.
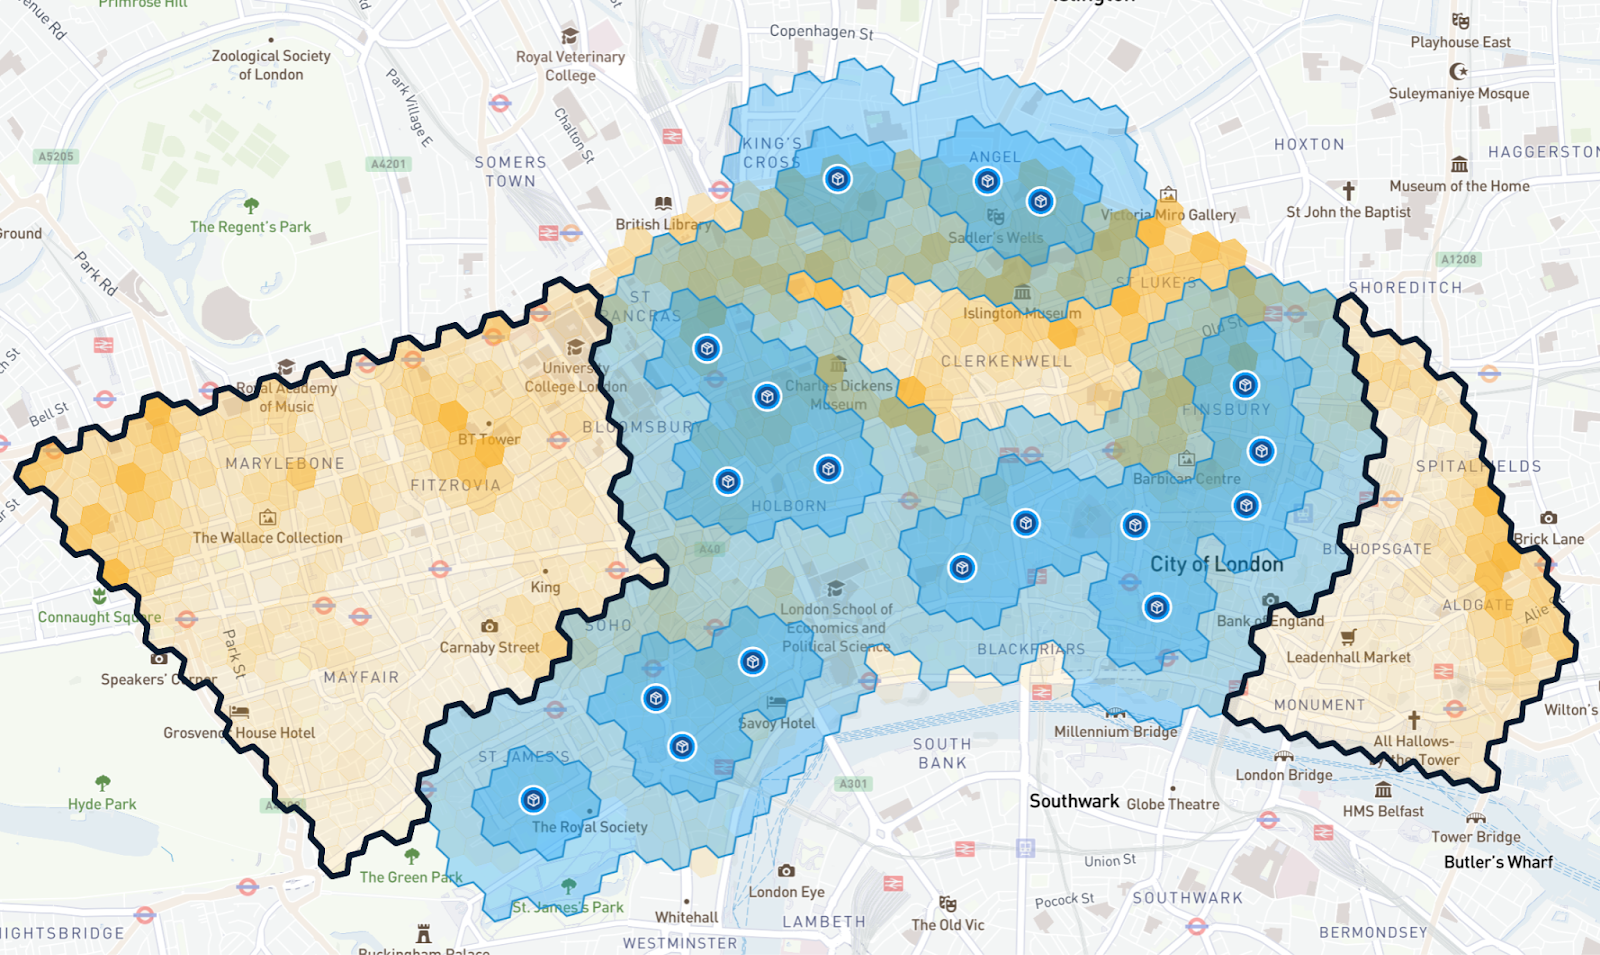
We can already see two distinct gaps – areas with no competitor presence, where we could capture unmet demand.
Mapping out partner locations
Our potential partner shops offer 41% coverage (based on population data) across their 22 locations if we used all of them.
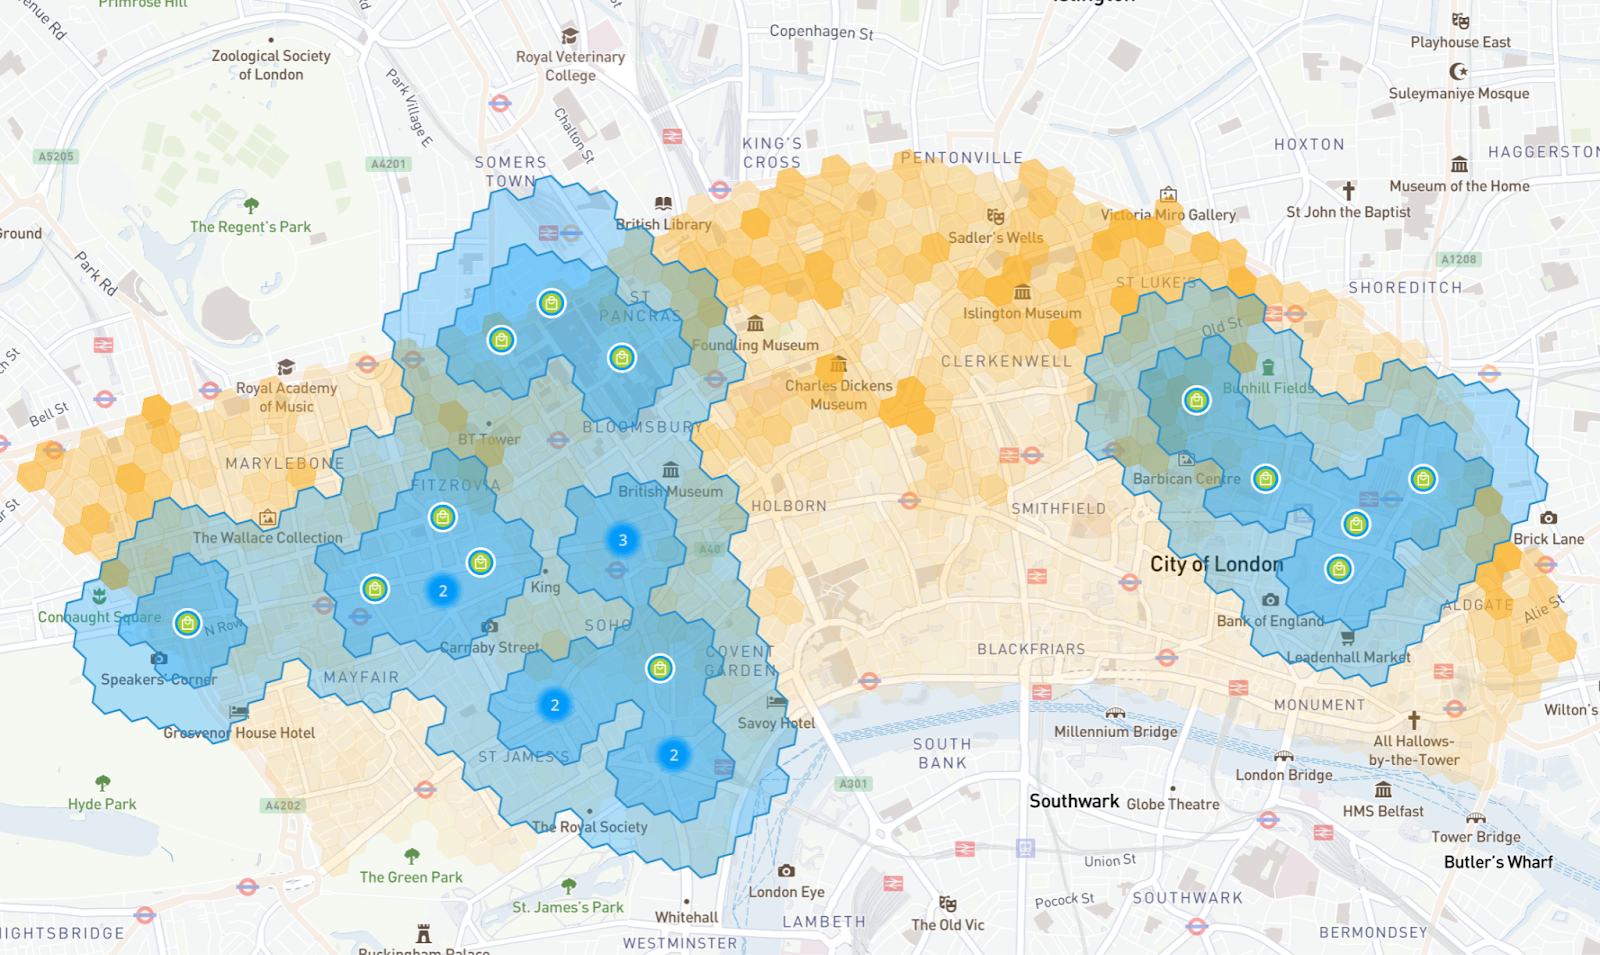
As with the competitor network, we can see that the shops aren’t evenly distributed across the entire area. The lower coverage could also indicate that we should carefully consider whether to roll out through the partnership or look for locations outside the partner network.
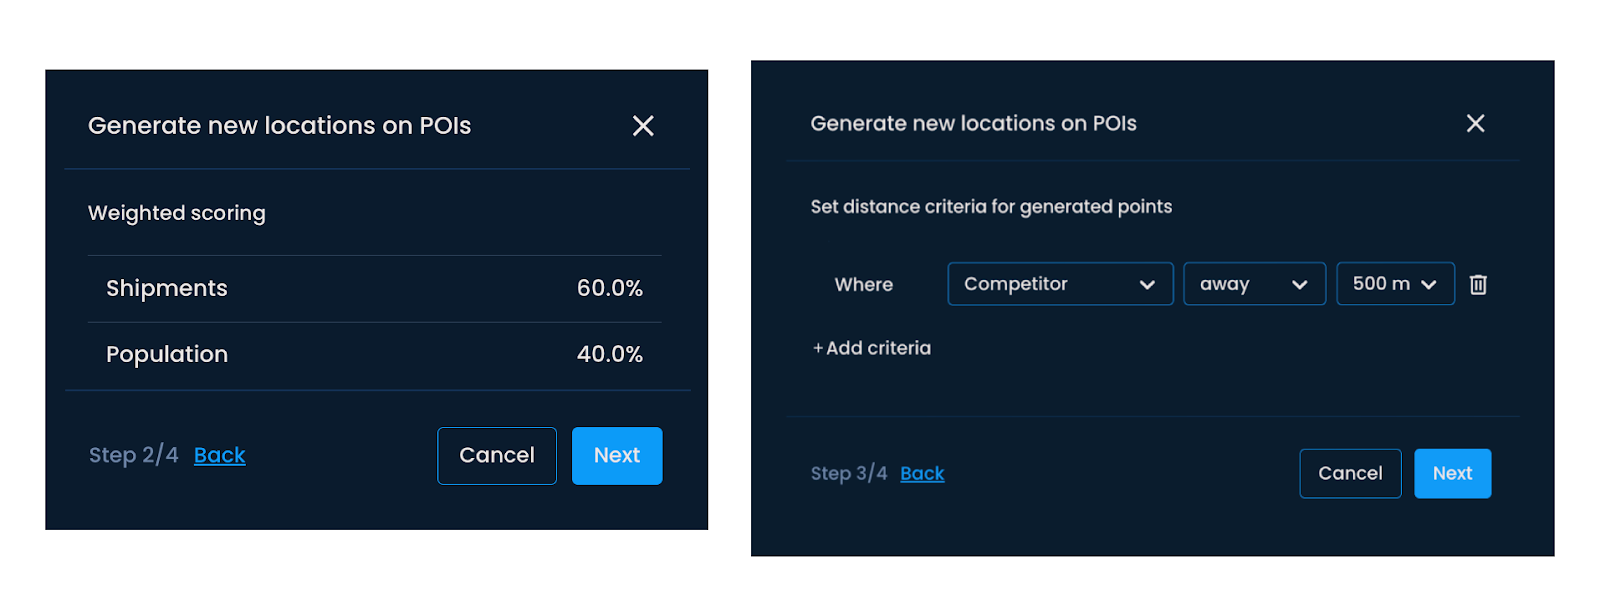
Calculating new location potential
Population density tells us how many people are in an area, but shipment volume tells us how many deliveries we actually have in the area during a specific period. To assess true demand potential, we need both.
We'll use weighted scoring to combine these factors. Weighted scoring assigns different levels of importance to each data input – in this case, 60% to shipment volume and 40% to population density. This means actual delivery activity influences our results more heavily than population alone, since it's a stronger indicator of locker demand. The platform calculates a score for each location reflecting its overall potential.
We'll also add a constraint: new locations must be at least 500 meters away from competitor lockers to ensure we can fill the gaps we’ve seen above.
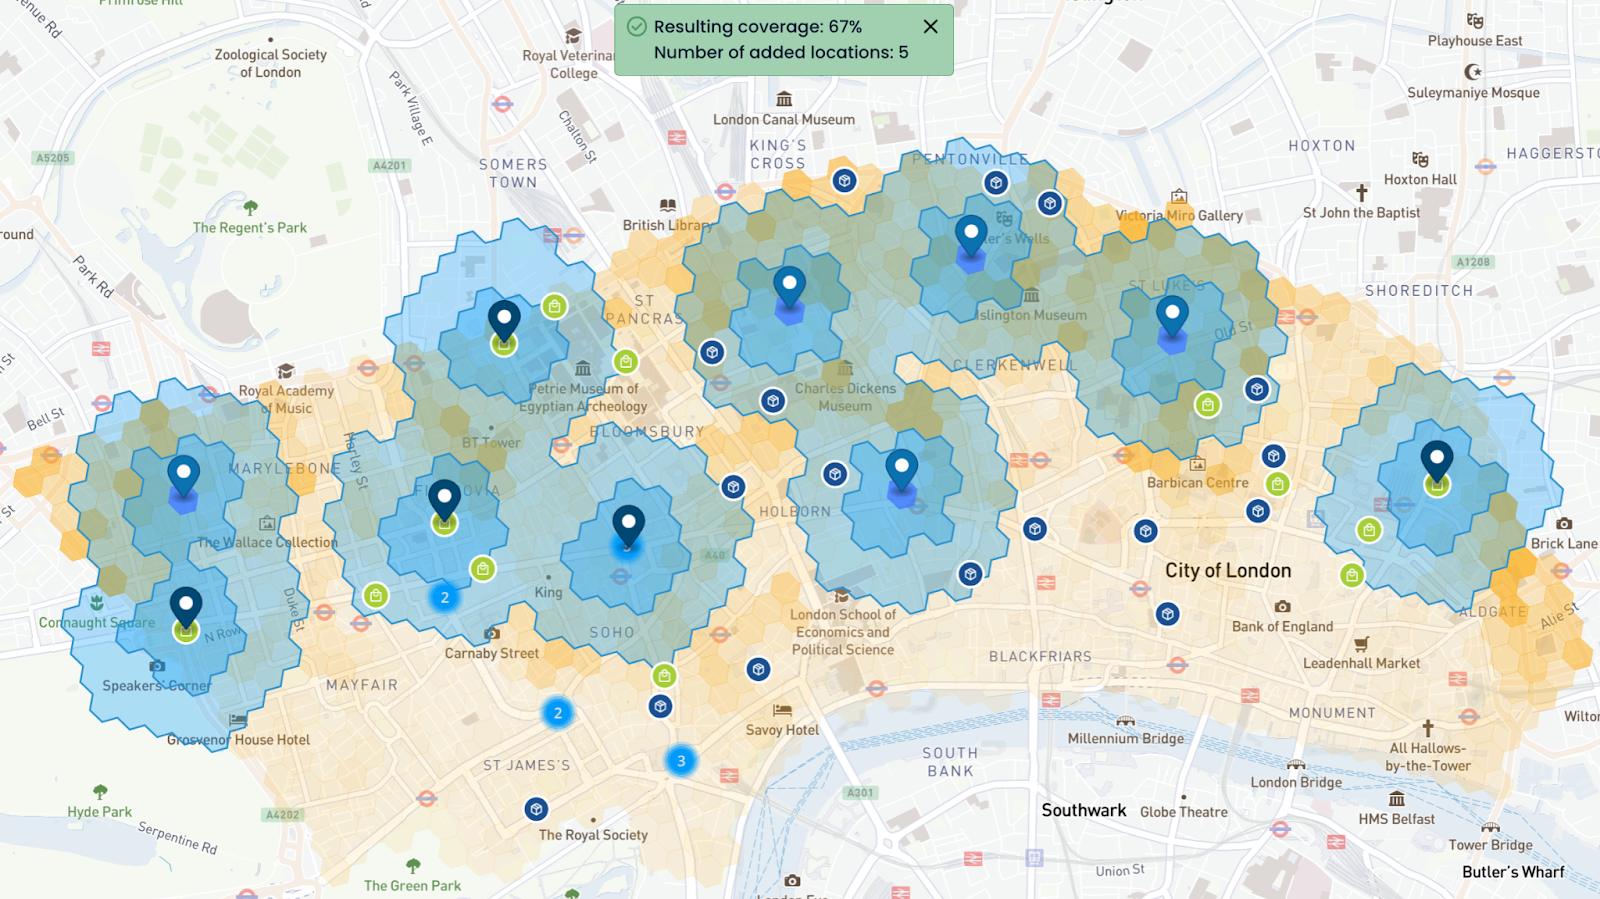
For starters, we’ll generate 5 optimal location recommendations from the partner network. The result is 20% coverage (combined shipment and population data), which is a solid start, but there's still a visible gap.
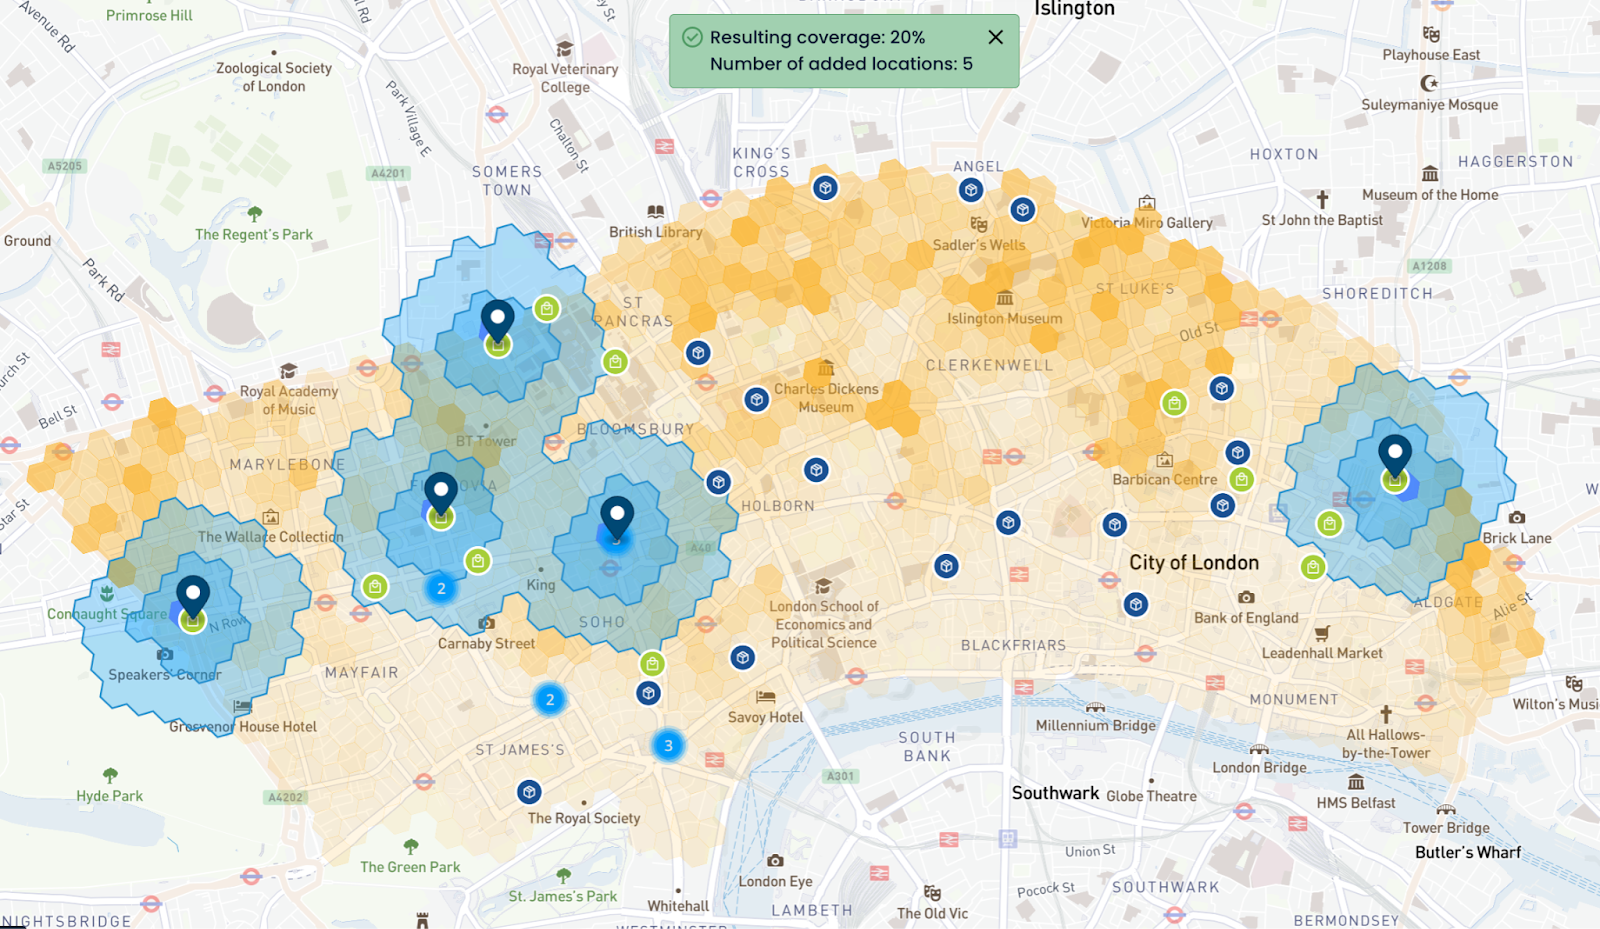
To fill the gaps, we can generate 5 additional locations outside the partner network. With a total of 10 locations, we can reach 67% coverage (based on combined shipment and population data).
As we’ve used weighted scouring, each location now has a score reflecting its potential coverage and strategic positioning. We can use these scores to prioritize which sites to visit first, focusing our time on the highest-potential locations.
Final remarks
Building and expanding parcel locker networks is anything but simple. Operators are juggling parcel volumes, site capacity, partner relationships, and coverage targets, while trying to avoid the drag of underperforming locations. And when decisions are based on incomplete data or gut feeling, location choice becomes risky.
That’s why it’s crucial to understand what makes a location “good” in your market and to back those decisions with solid spatial data. Investing in the right data and tools is far cheaper than fixing low-utilization lockers and funding costly relocations.


.png)